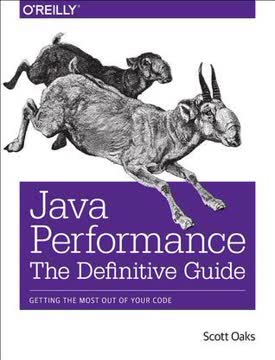
Key Takeaways
1. Optimize Java performance through strategic tuning and best practices
There is no magical -XX:+RunReallyFast option.
Performance is multifaceted. Java performance optimization involves a combination of writing efficient algorithms, tuning the JVM, and implementing best coding practices. It's not just about tweaking JVM flags, but also about understanding how Java works under the hood.
Measure, don't guess. Always profile your application before making optimizations. Use tools like jconsole, jstat, and Java Flight Recorder to gather data about your application's performance. Look for bottlenecks in CPU usage, memory allocation, and garbage collection.
Balance trade-offs. Performance optimization often involves trade-offs. For example:
- Increasing heap size can reduce GC frequency but may increase pause times
- Using more threads can improve throughput but may lead to increased context switching
- Aggressive inlining can speed up method calls but increase code size
Always test your optimizations in a realistic environment to ensure they provide the expected benefits without introducing new problems.
2. Master garbage collection for efficient memory management
GC engineers around the world are now groaning, since either of these techniques hampers the efficiency of GC.
Understand GC algorithms. Java offers several garbage collection algorithms, each with its strengths:
- Serial GC: Simple and efficient for small heaps and single-threaded applications
- Parallel GC: Focuses on maximizing throughput, good for batch processing
- CMS (Concurrent Mark Sweep): Aims to minimize pause times, suitable for responsive applications
- G1 (Garbage First): Balances throughput and pause times, good for large heaps
Tune GC parameters. Adjust GC parameters based on your application's needs:
- Set appropriate heap sizes (-Xms and -Xmx)
- Adjust generation sizes (e.g., -XX:NewRatio)
- Configure GC logging for analysis (-XX:+UseGCLogFileRotation)
Minimize object churn. Reduce the rate of object creation and garbage:
- Use object pools for expensive-to-create objects
- Prefer primitive types over wrapper classes when possible
- Use StringBuilder for string concatenation in loops
Remember, the goal is not to eliminate GC but to make it efficient and predictable.
3. Leverage thread pools and synchronization for optimal concurrency
Thread pools are one case where object pooling is a good thing: threads are expensive to initialize, and a thread pool allows the number of threads on a system to be easily throttled.
Use thread pools wisely. Thread pools help manage concurrency efficiently:
- Choose an appropriate pool size based on available CPUs and workload characteristics
- Use different pool types for different scenarios (e.g., FixedThreadPool, CachedThreadPool)
- Consider using a ForkJoinPool for divide-and-conquer algorithms
Minimize synchronization. Excessive synchronization can hurt performance:
- Use concurrent collections when possible (e.g., ConcurrentHashMap)
- Prefer atomic variables over synchronized blocks for simple operations
- Use the synchronized keyword judiciously, synchronizing on the smallest possible code block
Avoid contention. High contention for shared resources can lead to poor scalability:
- Use thread-local variables to eliminate sharing where possible
- Consider using lock-free algorithms for highly contended operations
- Be aware of false sharing and use appropriate padding techniques when necessary
4. Utilize profiling tools to identify and resolve performance bottlenecks
Profilers are the most important tool in a performance analyst's toolbox.
Choose the right profiler. Different profilers offer various insights:
- Sampling profilers: Low overhead, good for production environments
- Instrumented profilers: More detailed, but higher overhead
- Native profilers: Can profile JVM internals and native code
Analyze profiler output. Look for:
- Hot methods: Methods consuming the most CPU time
- Allocation hot spots: Places where many objects are created
- Lock contention: Methods spending time waiting for locks
Combine profiling techniques. Use multiple approaches for a comprehensive view:
- CPU profiling to find computational bottlenecks
- Memory profiling to identify memory leaks and excessive allocations
- Thread profiling to detect deadlocks and synchronization issues
Remember that profilers can affect application behavior, so always verify findings in a non-profiled environment.
5. Implement effective memory management techniques
Eliminating duplicate copies of immutable objects via canonicalization can greatly decrease the amount of heap an application uses.
Minimize object creation. Excessive object creation can strain the garbage collector:
- Use object pools for expensive-to-create objects
- Employ the Flyweight pattern for shared, immutable objects
- Utilize String.intern() for frequently used strings
Optimize collections. Choose appropriate collection types and sizes:
- Use ArrayList instead of LinkedList for random access
- Specify initial capacity for collections when size is known
- Consider using primitive collections (e.g., TIntArrayList) to avoid boxing
Manage large objects carefully. Large objects can cause fragmentation and long GC pauses:
- Use off-heap memory (e.g., ByteBuffer.allocateDirect()) for very large arrays
- Consider breaking large objects into smaller chunks
- Be cautious with finalizers, as they can delay object reclamation
6. Harness the power of JIT compilation for enhanced performance
There are a lot of details about Java that affect the performance of an application, and a lot of tuning flags are discussed. But there is no magical -XX:+RunReallyFast option.
Understand JIT basics. The Just-In-Time compiler optimizes frequently executed code:
- Code starts in interpreted mode and is compiled as it becomes "hot"
- Compiled code is stored in the code cache for future use
- The JIT can perform aggressive optimizations based on runtime information
Choose the right compiler. Java offers different compiler modes:
- Client: Fast startup, good for desktop applications
- Server: Better long-term performance, suitable for long-running server applications
- Tiered: Combines client and server modes for balanced performance
Fine-tune compilation. Adjust compilation behavior if needed:
- Control inlining with -XX:MaxInlineSize and -XX:FreqInlineSize
- Adjust the code cache size with -XX:ReservedCodeCacheSize
- Use -XX:+PrintCompilation to understand compilation behavior
Remember that most applications perform well with default JIT settings, so only tune when necessary and after thorough profiling.
7. Optimize native memory usage and footprint
The total of native and heap memory used by the JVM yields the total footprint of an application.
Monitor native memory usage. Native memory can be a significant part of JVM footprint:
- Use tools like jcmd with VM.native_memory to track native memory allocation
- Monitor the resident set size (RSS) of the JVM process
- Be aware of memory-mapped files and direct ByteBuffers
Optimize memory-mapped I/O. When using NIO:
- Reuse direct ByteBuffers to avoid allocation overhead
- Consider memory-mapped files for large datasets
- Be cautious with off-heap allocations, as they're not subject to GC
Tune native memory settings. Adjust native memory parameters:
- Set -XX:MaxDirectMemorySize to limit direct ByteBuffer allocations
- Use -XX:NativeMemoryTracking=summary for detailed native memory usage
- Consider using compressed ordinary object pointers (-XX:+UseCompressedOops) for 64-bit JVMs with heaps < 32GB
8. Leverage Java 8 features for improved performance and parallelism
Features in Java 8 that use automatic parallelization will use a common instance of the ForkJoinPool class.
Utilize streams for concise, parallel operations. Java 8 streams offer easy parallelization:
- Use parallel streams for CPU-intensive operations on large datasets
- Be cautious with I/O-bound or ordering-dependent operations in parallel streams
- Adjust the common ForkJoinPool size with java.util.concurrent.ForkJoinPool.common.parallelism
Leverage new concurrent utilities. Java 8 introduces new tools for concurrency:
- Use LongAdder instead of AtomicLong for high-contention counters
- Employ StampedLock for read-write locks with optimistic reading
- Utilize CompletableFuture for complex asynchronous operations
Optimize with lambda expressions and method references. These can lead to more efficient code:
- Use method references instead of lambdas where possible for better inlining
- Leverage the new functional interfaces in java.util.function package
- Be aware that excessive use of tiny lambdas can increase pressure on the JIT compiler
Remember that while Java 8 features can improve performance, they're not a silver bullet. Always measure the impact in your specific use case.
Last updated:
FAQ
1. What is "Java Performance: The Definitive Guide" by Scott Oaks about?
- Comprehensive Java performance focus: The book explores the art and science of Java performance, delving into JVM internals, garbage collection, JIT compilation, and Java SE/EE API optimizations.
- Bridging theory and practice: Scott Oaks balances theoretical concepts with actionable advice, helping readers understand both how Java works under the hood and how to apply best practices in real-world scenarios.
- Holistic performance coverage: Topics include memory management, threading, synchronization, object lifecycle, web container tuning, database access, and more, providing a complete view of Java performance engineering.
2. Why should I read "Java Performance: The Definitive Guide" by Scott Oaks?
- Expert, actionable guidance: Scott Oaks is a recognized authority on Java performance, offering proven strategies to optimize applications and avoid common pitfalls.
- Covers both Java SE and EE: The book addresses performance considerations for a wide range of Java applications, from core language features to enterprise technologies like EJBs and JPA.
- Emphasizes measurement and tuning: Readers learn the importance of testing in real environments, using the right tools, and making data-driven optimization decisions.
3. What are the key takeaways from "Java Performance: The Definitive Guide" by Scott Oaks?
- Performance is both art and science: Deep JVM knowledge, experience, and intuition are all necessary for effective tuning.
- Test and measure in context: Realistic, repeated, and statistically analyzed performance testing is essential for meaningful results.
- Holistic optimization: Effective performance work spans JVM tuning, code best practices, memory management, threading, and external system considerations.
4. What are the best quotes from "Java Performance: The Definitive Guide" by Scott Oaks and what do they mean?
- "Performance tuning is part art and part science." This highlights the need for both technical knowledge and practical intuition in optimizing Java applications.
- "Test real applications, not just microbenchmarks." Emphasizes that only real-world testing reveals true performance characteristics and bottlenecks.
- "The law of diminishing returns applies to heap sizing." Reminds readers that simply increasing heap size won’t always yield better performance and can sometimes make things worse.
5. How does Scott Oaks in "Java Performance: The Definitive Guide" recommend approaching Java performance testing?
- Test real-world scenarios: Performance testing should be conducted on the actual application as it will be used, not just on isolated modules or microbenchmarks.
- Account for variability: Run tests multiple times and use statistical analysis (like Student’s t-test) to distinguish real regressions from random noise.
- Integrate testing early: Automated, frequent performance testing in the development cycle helps catch regressions and collect comprehensive data for analysis.
6. What are the main Java Virtual Machine (JVM) internals and tuning strategies discussed in "Java Performance: The Definitive Guide"?
- JIT compilation: The JVM interprets bytecode initially, then compiles hot methods to native code for better performance; tuning involves selecting compiler modes and managing code cache.
- Garbage collection algorithms: The book covers serial, throughput (parallel), CMS, and G1 collectors, each with different trade-offs for pause times, throughput, and heap sizes.
- Heap and generation sizing: Properly sizing the heap and its generations, and tuning related flags, is crucial to balancing GC frequency, pause times, and memory usage.
7. What are the key garbage collection (GC) algorithms and their trade-offs in "Java Performance: The Definitive Guide" by Scott Oaks?
- Serial collector: Simple and single-threaded, best for small heaps and single-CPU systems, but causes long pause times.
- Throughput (Parallel) collector: Multi-threaded, maximizes throughput but can have long pauses during full GC cycles.
- Concurrent Mark Sweep (CMS): Reduces pause times by doing most work concurrently, but uses more CPU and can suffer from fragmentation and promotion failures.
- G1 collector: Designed for large heaps, divides memory into regions, balances pause times and throughput, and reduces fragmentation risk.
8. How does "Java Performance: The Definitive Guide" by Scott Oaks advise choosing and tuning a garbage collector for your application?
- Match GC to workload: Use serial GC for small heaps or single CPUs, throughput GC for maximizing throughput on multi-CPU systems, and CMS or G1 for low-pause requirements and large heaps.
- Consider application type: Batch jobs with available CPU may benefit from concurrent collectors, while CPU-limited jobs may perform better with throughput GC.
- Tune for response time goals: Throughput GC often yields better average response times, while concurrent collectors like CMS and G1 improve 90th/99th percentile response times by reducing long pauses.
9. What are the best practices for heap memory management and avoiding out-of-memory errors in "Java Performance: The Definitive Guide"?
- Minimize object creation: Create objects sparingly and discard them quickly to reduce GC pressure, but balance this with the cost of recreating expensive objects.
- Use object reuse techniques: Employ thread-local variables, object pools, and indefinite references (soft, weak, phantom) judiciously to manage memory efficiently.
- Analyze and monitor heap: Use tools like jcmd, jmap, and heap analyzers to identify memory leaks and optimize object retention; trigger heap dumps on out-of-memory errors for diagnosis.
10. What threading and synchronization performance advice does Scott Oaks provide in "Java Performance: The Definitive Guide"?
- Thread pool sizing: Set minimum and maximum thread pool sizes thoughtfully, often matching the number of worker threads to available CPUs.
- Avoid thread oversubscription: Too many threads can degrade performance, especially for CPU-bound tasks or when external bottlenecks exist.
- Minimize synchronization costs: Reduce the use of synchronized blocks to avoid contention; prefer lock-free utilities and thread-local variables for better scalability.
11. How does "Java Performance: The Definitive Guide" by Scott Oaks address Java EE performance, including HTTP session state, EJBs, and database access?
- Manage HTTP session memory: Minimize session data and use server features to serialize or cache session state, reducing heap impact and GC pauses.
- Tune EJB pools and caches: Pool EJBs to reduce initialization costs, set steady pool sizes carefully, and avoid passivation for stateful beans to maintain performance.
- Optimize database access: Use prepared statements, statement pooling, batch operations, and properly sized connection pools; manage transactions and locking to improve scalability.
12. What are the performance implications of Java 8 features like lambdas and streams in "Java Performance: The Definitive Guide"?
- Lambdas vs. anonymous classes: Lambdas offer similar runtime performance but reduce classloading overhead, as they are implemented as static methods.
- Streams enable lazy evaluation: Streams process data lazily, allowing for early termination and potential performance gains over eager processing.
- Parallel processing and filters: Streams facilitate parallel processing on multi-core systems, and while multiple filters add some overhead, they can outperform traditional iterators in many cases.
Review Summary
Java Performance is highly praised as an essential, comprehensive guide for Java developers. Readers commend its in-depth coverage of JVM internals, garbage collection, and performance optimization techniques. While some find it challenging due to its technical density, many consider it a must-read for experienced developers. The book is noted for its practical examples, benchmarks, and up-to-date information on Java 7 and 8. Reviewers consistently rate it highly, comparing it favorably to other respected Java texts and recommending it for those seeking to enhance their understanding of Java performance.
Similar Books




Download PDF
Download EPUB
.epub digital book format is ideal for reading ebooks on phones, tablets, and e-readers.
