Key Takeaways
Strip your charts bare — price action off one chart beats any indicator
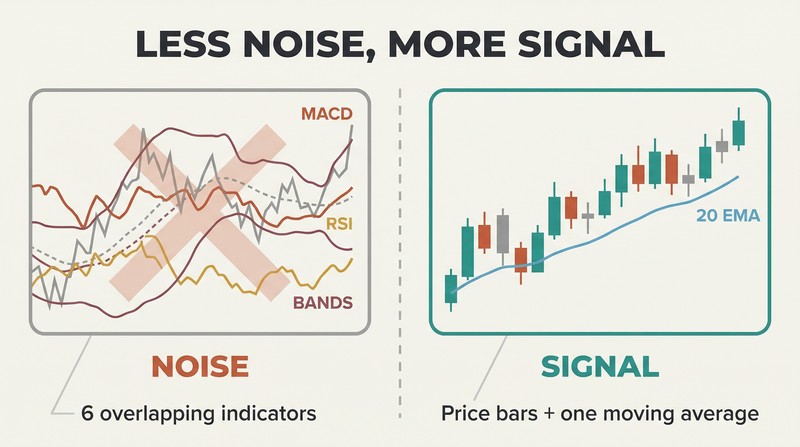
Al Brooks left ophthalmology to trade full time and spent over 10,000 hours testing indicators and automated systems before discovering that price action alone — reading individual bars on a single 5-minute chart — was all he needed. His entire setup: a laptop, one chart, and a 20-bar exponential moving average. No MACD, no RSI, no Bollinger Bands.
Every bar reveals who controls the market. A bar with a strong close above its open (a bull trend bar) means buyers dominate. A bar with a tiny body (a doji) means equilibrium — a one-bar trading range. Brooks argues indicators obfuscate rather than elucidate, and watching a 1-minute chart while trading a 5-minute chart splits your attention and bleeds profits. The fundamental question at every bar: is the market trending, or is it in a trading range?
Only fade a trend after countertrend traders first prove their strength
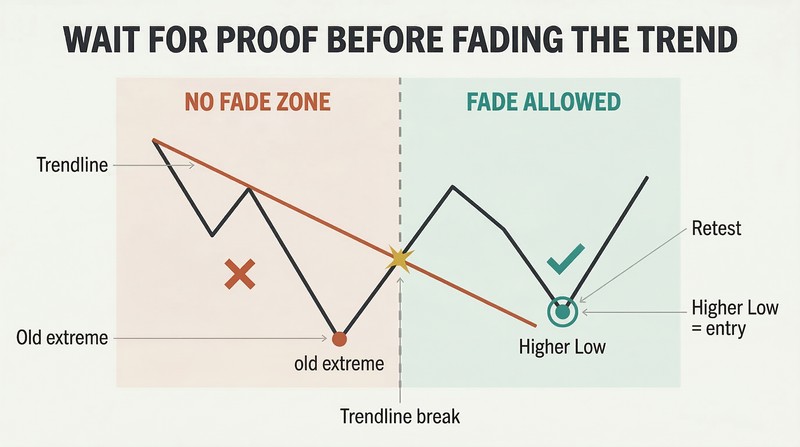
This is Brooks' iron law. In a strong downtrend, buying a discounted price without a prior trendline break is gambling against math. The trend continues until countertrend traders demonstrate real strength — a rally that breaks a significant trendline with momentum. Only then should you watch for the old extreme to be retested.
Even after a trendline break, the first trade should still be With Trend — expecting a test of the old extreme. The countertrend entry comes only after the extreme is retested and a pattern like a Lower High (bear reversal) or Higher Low (bull reversal) forms. If you find yourself drawing multiple trend channel lines looking for a top, you're in denial about the trend in front of you — and missing the most profitable With Trend entries.
Three overlapping bars with dojis near the EMA — step away
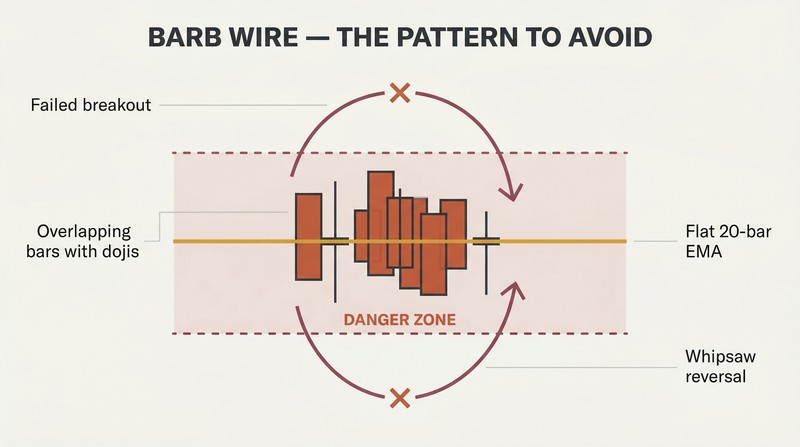
Brooks calls this Barb Wire and declares it the single most important thing to avoid. The pattern: three or more overlapping bars near the flat 20-bar EMA where at least one is a doji. It represents perfect equilibrium — neither bulls nor bears control the market. Every breakout attracts hopeful traders, and most immediately reverse.
Brooks' approach if you must trade it: wait for a strong trend bar to break out, then fade it. If that fade also fails, the second entry (a Breakout Pullback) is highly reliable. The cardinal sub-rule: never buy above Barb Wire if bars are below the EMA, never sell below it if bars are above. Brooks estimates that avoiding this pattern alone can turn a losing trader into a winner.
A single rejection means nothing — two failed breakouts change everything
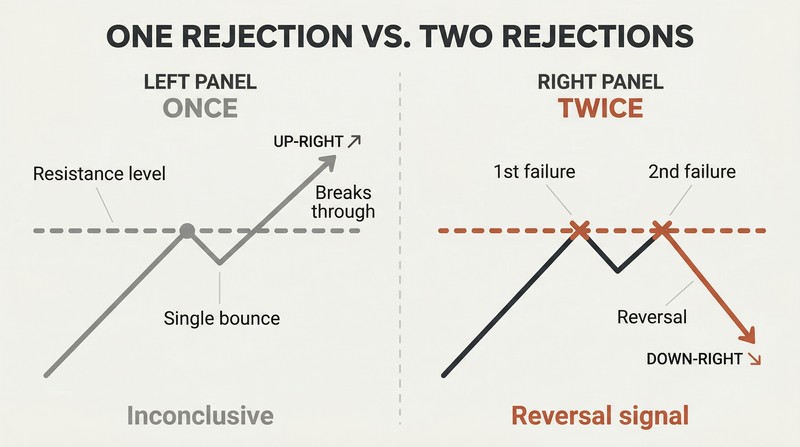
This principle underlies dozens of Brooks' specific patterns. Double Tops, Double Bottoms, failed High/Low 2 setups, and Expanding Triangles all share one root: when the market pushes twice at a price level and can't get through, something fundamental shifts. Sellers who shorted twice and failed won't try a third time soon. Buyers who defended twice add to positions with conviction.
The practical application: after a bear trendline break, if the market rallies back to the old high and fails (forming a Lower High), that's your short entry. The corollary also holds — if a second attempt at something succeeds, the move extends far because the failed defenders must exit, pouring fuel on the breakout.
Trust the trend entry even when every instinct says it's too late
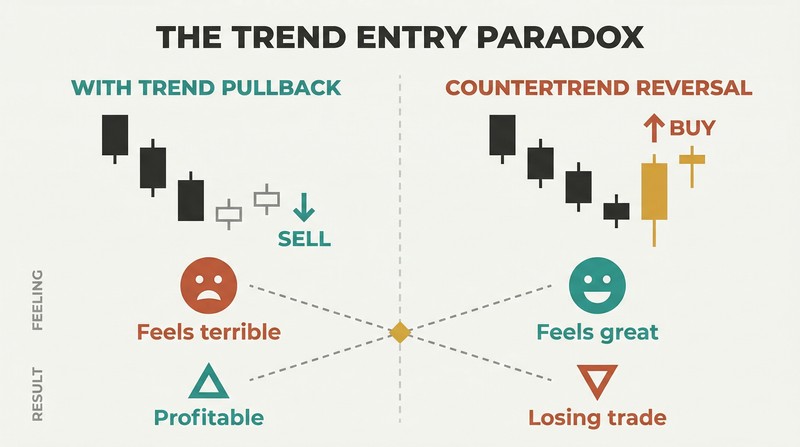
Strong trends produce a paradox. The best With Trend entries occur during pullbacks that look like the trend is ending. The worst countertrend entries appear at moments that look like obvious reversals. Brooks notes that on many trend days, the most impressive reversal bars and biggest trend bars are actually countertrend — trapping traders into the wrong direction.
In a strong bear, selling near the day's low feels absurd — but that is exactly where smart money enters. Meanwhile, that beautiful bull reversal bar with the long tail tempts countertrend traders, only to collapse within minutes. Brooks' rule: during strong trends, every countertrend setup should be viewed as a With Trend entry. Place your order where the countertrend traders will have their protective stops.
Place your entries where trapped traders have their protective stops
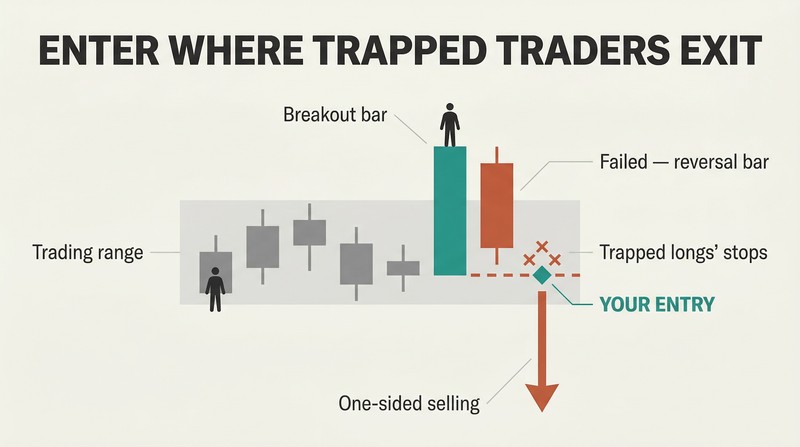
Every failed entry creates fuel. When traders enter and the market immediately reverses past their stop, that forced exit creates momentum in your direction. Brooks teaches traders to identify where stops cluster — typically one tick beyond a signal bar or entry bar — and place entry orders at exactly those prices.
The cleanest examples are failed breakouts. If a bull trend bar breaks out of a trading range and the next bar reverses into a small bear inside bar, those who bought the breakout are trapped. Selling one tick below that inside bar puts you short precisely where trapped longs must cover. With no buyers willing to re-enter until more price action develops, the market becomes one-sided in your favor — all sellers, no buyers.
A failed pattern creates a better setup than the original
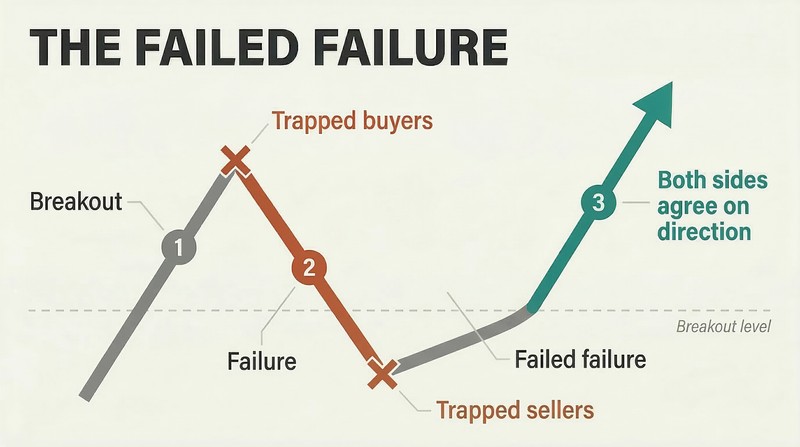
Brooks turns failure into edge. A Failed Final Flag occurs when a horizontal flag at the end of a trend breaks out but quickly reverses — often marking the actual trend's end and triggering a multi-leg countertrend move. A failed Wedge reversal produces a Measured Move equal to the Wedge's height in the original trend direction.
The most powerful variant is the failed failure — a Breakout Pullback. When a breakout fails (trapping breakout traders), then that failure also fails, the market has resolved two layers of uncertainty. Both sides now agree on direction. This double-confirmation makes Breakout Pullbacks among Brooks' most reliable setups. Failed ii patterns, failed High 2 longs in bears, and failed Low 2 shorts in bulls all function this way.
Wait for the second entry — the market charges more for better odds
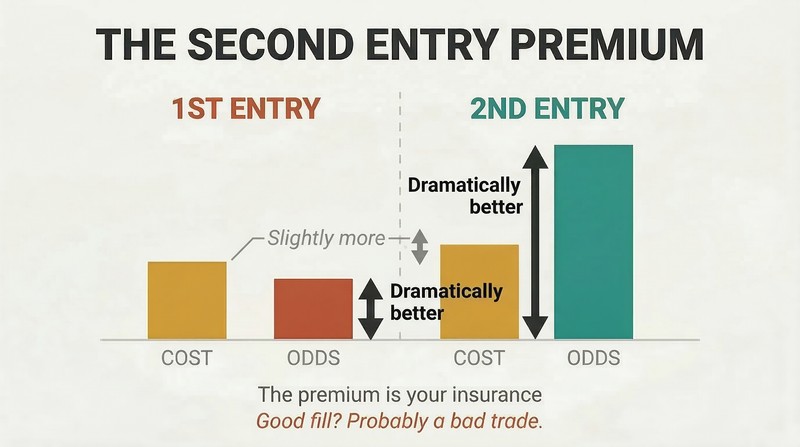
First entries fail often because not enough traders are convinced. A High 1 pullback in a bull may reverse, but a High 2 — the second time a bar's high exceeds the prior bar's high during a correction — carries far more weight because both sides now see the first countertrend attempt failed. Daily chart bottoms almost always require a second reversal off the low.
Brooks warns about the good-fill-bad-trade trap: if a second entry lets you in at a better price than the first, be suspicious. Genuine second entries typically cost slightly more — that premium is your insurance for dramatically better odds. The corollary: if a second entry also fails, assume you're misreading the market and stop trading that direction entirely.
Two-legged pullbacks to the EMA in a strong trend are the best trade
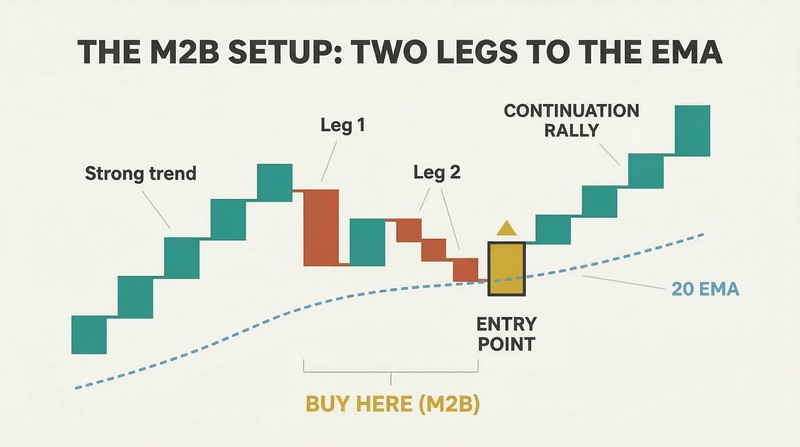
Brooks calls this setup M2B / M2S (moving average, second entry, buy) in bulls and M2S (sell) in bears. It combines three of his highest-conviction elements: a confirmed strong trend, a two-legged correction, and a touch of the 20-bar EMA. In a bull, wait for two downward legs that bring price back to the EMA, then buy above the setup bar.
This works because each EMA touch in a strong trend re-engages institutional buyers. When price stays on one side of the EMA for two hours or more — what Brooks calls a 2HM pattern — the first EMA touch is particularly reliable. Take every M2B in a bull and every M2S in a bear, and swing at least half your position, because these moves frequently extend far beyond what seems reasonable.
Trade fewer setups with maximum size, not more setups with minimum
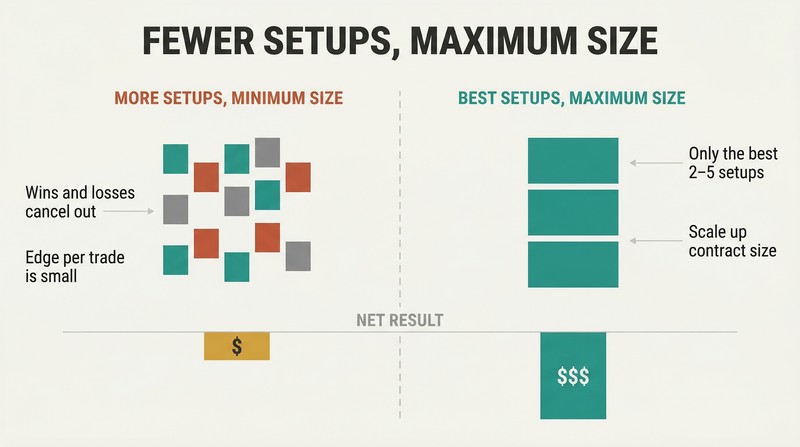
Brooks' math is stark. A trader who consistently nets just one point per day trading 100 Emini contracts earns over $1 million per year. Four points yields $4 million. The Emini handles this volume without significant slippage. By contrast, adding lower-probability setups to increase trade count introduces losses that erode the edge built by the best setups.
Brooks recommends beginners limit themselves to two to five setups per day — primarily M2B/M2S entries in trends and second entry reversals at swing extremes on range days. Once consistently profitable, shift focus to contract count, not setup variety. Start with 100-500 SPY shares before graduating to Emini contracts. The single worst habit: Barb Wire scalping in midday trading ranges, which feels productive but mathematically destroys accounts.
Analysis
Al Brooks' Reading Price Charts Bar by Bar occupies an unusual position in trading literature: simultaneously one of the most comprehensive and most impenetrable technical analysis texts ever published. Written in 2009, it argued that the entire indicator-industrial complex — MACD, RSI, Bollinger Bands — was unnecessary overhead degrading performance. This was contrarian even within technical analysis circles.
Brooks' framework is philosophically closer to classical tape reading — the art practiced by Jesse Livermore — than to modern algorithmic analysis. His core claim is that every bar on a chart is information-rich and, when read in context, reveals the real-time balance of institutional buying and selling pressure. This puts him in productive tension with the efficient market hypothesis: he does not claim markets are inefficient, but rather that the footprint of efficiency itself — patterns created by millions of rational actors — is readable and tradable by those willing to invest years of screen time.
The book's greatest weakness is also its greatest strength: density. With over 400 pattern names and countless variations, it functions more as an encyclopedia than a learning curriculum. The lack of quantified backtesting data is notable — Brooks relies entirely on qualitative observation and personal experience, introducing survivorship bias risk. His occasional political commentary has aged poorly and undermines analytical credibility.
Nevertheless, Brooks' intellectual contribution is substantial. His taxonomy of pattern failures — the insight that a failed pattern constitutes a superior setup — represents genuine progress in technical analysis thinking. His framework of trapped traders as market fuel provides a coherent causal theory for why price action patterns work, transcending mere pattern recognition toward something approaching market microstructure theory. The concept of Barb Wire alone — and its role as the most dangerous pattern for breakout traders — illustrates how Brooks identifies structural traps invisible to indicator-dependent systems. For the serious discretionary trader willing to invest years of study, this framework offers radical self-sufficiency: no subscriptions, no indicators, no dependencies beyond a single price chart and the discipline to read it.
Review Summary
Reading Price Charts Bar by Bar receives mixed reviews. While praised for its wealth of information on price action trading, many find it overwhelming and difficult to read. Positive reviewers consider it essential for serious traders, offering valuable insights. Critical readers struggle with the dense writing style, poor organization, and lack of clarity. Some suggest it's not suitable for beginners. Despite its flaws, many acknowledge the book's depth of content and potential value for experienced traders willing to invest time in deciphering the material.
Glossary
Barb Wire
Overlapping doji pattern near EMAA trading range of three or more bars that largely overlap, where at least one bar is a doji, typically occurring near the 20-bar EMA in the middle of the day's range. It signals equilibrium between bulls and bears. Most breakouts from Barb Wire fail immediately, making it the most dangerous pattern for breakout traders. Brooks considers avoiding it the single most important loss-prevention technique.
Signal Bar
Bar preceding trade entryThe bar immediately before the entry bar—the bar during which a trade order is actually filled. It becomes a signal bar only in hindsight, once the entry is triggered. For beginners, Brooks recommends signal bars should be trend bars in the direction of the intended trade: bull trend bars for longs, bear trend bars for shorts. Doji signal bars are unreliable except in specific high-probability contexts.
M2B / M2S
Second entry at moving averageM2B (Moving Average Buy, 2nd entry) and M2S (Moving Average Sell, 2nd entry) are Brooks' names for a High/Low 2 setup where one or more bars of the pullback touches the 20-bar EMA. It combines a strong trend, a two-legged correction, and an EMA test into one of Brooks' highest-probability setups. Take every M2B in a bull trend and every M2S in a bear.
With Trend
Trading the prevailing directionA trade or setup in the direction of the current trend. Brooks determines trend direction by the position of most recent bars relative to the EMA—if most bars are above it, With Trend means buying; below it, selling. The opposite is Countertrend. Brooks' cardinal principle: never trade Countertrend without a prior significant trendline break, and always prioritize With Trend entries over Countertrend scalps.
Failed Final Flag
Last flag breakout reversesA horizontal flag or consolidation that forms after a protracted trend, breaks out to a new extreme in the trend's direction, but quickly reverses within a few bars. The failure often marks the actual end of the trend and triggers a multi-leg countertrend move. An ii pattern at the end of a long trend is a classic setup. The flag must break a trendline for the reversal to be meaningful.
Breakout Pullback
Pullback after successful breakoutA small one-to-five-bar pullback occurring shortly after a breakout beyond a significant price level. It is technically a 'failed failure'—the breakout appeared to fail, but then the failure itself fails, confirming the original breakout direction. Because it resolves two layers of uncertainty, it is among Brooks' most reliable entry setups. Also called a cup-and-handle by some traditional technicians.
High/Low 2
Second pullback attempt counterA bar-counting system for tracking pullback legs. In a bull pullback, a High 1 is the first bar whose high exceeds the prior bar's high; a High 2 is the second such occurrence after an intervening lower high. It marks the end of a two-legged correction. The High 2 long and Low 2 short are among Brooks' most reliable With Trend entries, especially when they occur near the EMA.
2HM
Two hours from the EMAA condition where the market has not touched the 20-bar exponential moving average for two or more hours. It indicates a very strong trend. The first EMA touch after a 2HM pattern is a high-probability With Trend entry for at least a scalp. The first EMA Gap Bar—a bar entirely on the countertrend side of the EMA—is also a reliable With Trend fade setup after a 2HM.
Spike and Channel
Sharp move then gentle driftA trend pattern beginning with an aggressive momentum move (spike) followed by a less steep, channel-like continuation in the same direction. The channel often has frequent small pullback bars that tempt countertrend traders prematurely. The start of the channel is typically tested within a day or two after the channel breaks. Only trade With Trend during the channel phase; consider countertrend entries only after the channel breaks.
Micro Trendline
Steep short-term trendlineA trendline drawn across 2 to about 10 bars in a strong trend where most bars touch or nearly touch the line. A one-or-two-bar false breakout through a Micro Trendline sets up a high-probability With Trend entry—the most reliable form of a High/Low 2 signal. If the false breakout entry itself fails, it becomes a Breakout Pullback in the opposite direction.
FAQ
What's Reading Price Charts Bar by Bar about?
- Focus on Price Action: The book emphasizes understanding price action as a key to successful trading, teaching traders to analyze price movements bar by bar.
- Target Audience: It is aimed at serious traders, both novice and experienced, who want to improve their trading strategies and risk-reward ratios.
- Comprehensive Guide: Covers various aspects of technical analysis, including trends, pullbacks, and trading ranges, providing a detailed framework for informed trading decisions.
Why should I read Reading Price Charts Bar by Bar?
- Practical Trading Strategies: Offers actionable strategies based on real market scenarios, making it a practical resource for traders.
- Improved Decision-Making: By learning to read charts effectively, traders can make better decisions in real-time, increasing their chances of success.
- Long-Term Success: Insights provided can lead to more consistent profitability over time, as traders learn to identify high-probability setups and avoid common pitfalls.
What are the key takeaways of Reading Price Charts Bar by Bar?
- Importance of Each Bar: Every bar on a chart contains valuable information that can influence trading decisions.
- Trend Analysis: Understanding whether the market is trending or in a trading range is crucial for making informed trades.
- Risk Management: Effective risk management strategies are emphasized, helping traders protect their capital while maximizing potential gains.
How does Al Brooks define price action in Reading Price Charts Bar by Bar?
- Broad Definition: Price action is any change in price on any chart type or time frame, including every tick during trading.
- Key to Trading: Understanding price action allows traders to make informed decisions based on real-time market behavior.
- Dynamic Nature: Price action is dynamic and can change rapidly, requiring traders to be vigilant and adaptable.
How does Al Brooks suggest identifying trends in Reading Price Charts Bar by Bar?
- Trend Definition: A trend is identified by a series of price changes that are predominantly upward (bull trend) or downward (bear trend).
- Use of Trendlines: Emphasizes drawing trendlines to visually represent the market direction, with breaks often signaling potential reversals.
- Signs of Strength: Look for signs of strength in trends, such as trending highs and lows, to confirm the trend's validity.
What are pullbacks, and how are they significant in Reading Price Charts Bar by Bar?
- Definition of Pullbacks: A pullback is a temporary move against the prevailing trend, often characterized by a bar that moves against the trend.
- Two-Legged Moves: Pullbacks typically consist of two legs, indicating a continuation of the original trend after the pullback.
- Trading Opportunities: Provide traders with opportunities to enter trades at better prices, enhancing risk-reward ratios.
What is the significance of trendlines and trend channels in Reading Price Charts Bar by Bar?
- Trendline Functionality: Used to identify market direction and potential reversal points, helping traders visualize the trend.
- Trend Channel Lines: Drawn parallel to trendlines, identifying potential areas of support and resistance.
- Dueling Lines: Intersection of trendlines and trend channel lines can create high-probability trading setups.
How does Reading Price Charts Bar by Bar address the concept of trading ranges?
- Understanding Trading Ranges: Occur when the market is not trending, with price moving within a defined range.
- Fading Extremes: Encourages fading the extremes of trading ranges, as these areas often provide high-probability setups.
- Transition to Trends: Provides strategies for identifying when trading ranges transition into trends.
What are some specific trading strategies mentioned in Reading Price Charts Bar by Bar?
- High/Low 2 Setups: Reliable entry points in trending markets, occurring after a pullback and indicating trend continuation.
- Breakout Pullbacks: Entering after a breakout and waiting for a pullback to confirm the trend, minimizing risk.
- Failed Breakouts: Trading failed breakouts to capitalize on market reversals, often leading to strong moves in the opposite direction.
What is the significance of "failed breakouts" in Reading Price Charts Bar by Bar?
- Indication of Market Reversal: Often signal a reversal in market direction, providing valuable entry points.
- Trapped Traders: Create selling pressure as traders exit positions, driving the price in the opposite direction.
- High Probability Setups: Trading failed breakouts can lead to high-probability setups, capitalizing on resulting price movements.
How does Al Brooks define a "Wedge" in Reading Price Charts Bar by Bar?
- Three Pushes Pattern: Characterized by three pushes in the same direction, with converging trendlines indicating potential reversal.
- Trendline Breaks: Culminates in a break of the trendline, signaling a change in market direction.
- Trading Strategy: Caution is advised, as Wedges can lead to false breakouts; wait for confirmation before trading.
What are the best quotes from Reading Price Charts Bar by Bar and what do they mean?
- "You have to keep looking ahead": Focus on current market conditions rather than past mistakes, encouraging adaptability.
- "Price action is the movement that takes place along the way as institutions probe for value": Understanding price action is key to recognizing institutional behavior.
- "Don’t trade what you believe should be happening. Only trade what is happening.": Focus on current market conditions rather than expectations, requiring adaptability.
About the Author
Other books by Al Brooks
Download PDF
Download EPUB
.epub digital book format is ideal for reading ebooks on phones, tablets, and e-readers.


