Key Takeaways
1. The BCG Growth-Share Matrix: A Strategic Tool for Portfolio Management
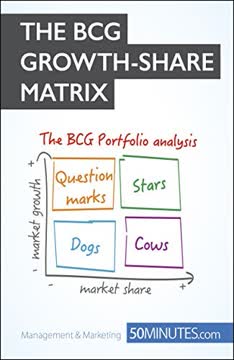
The BCG growth-share matrix instructs the user to divide the various SBUs based on their anticipated growth and relative market share.
Origin and purpose. Developed by the Boston Consulting Group in the 1960s, the BCG growth-share matrix emerged as a response to the increasing complexity of business portfolios. It aims to help managers make informed decisions about resource allocation across different strategic business units (SBUs).
Key components. The matrix is based on two primary factors:
- Market growth rate: Indicates the development potential of a market
- Relative market share: Compares a company's market share to that of its largest competitor
By plotting SBUs on these axes, managers can gain valuable insights into their portfolio's balance and potential for future success.
2. Understanding the Four Quadrants: Stars, Cash Cows, Question Marks, and Dogs
Thanks to the aforementioned information, we can separate the chart into four quadrants to distinguish the different types of SBUs and their cash flows.
Stars. High market share in a growing market. These SBUs require significant investment but offer high potential returns.
Cash Cows. High market share in a mature or declining market. These generate steady profits with minimal investment.
Question Marks. Low market share in a growing market. These require careful consideration and potentially significant investment to become stars.
Dogs. Low market share in a slow-growth market. These SBUs often consume more resources than they generate and may need to be divested.
3. Market Growth Rate and Relative Market Share: The Two Axes of Analysis
The vertical axis corresponds to the market growth rate, meaning the development potential of the market in the coming years.
Market Growth Rate. This axis typically ranges from 0% to 20+%, with 10% often used as the midpoint. It represents the annual growth rate of the market in which the SBU operates.
Relative Market Share. Calculated as the ratio of an SBU's market share to that of its largest competitor. A value greater than 1 indicates market leadership.
- Formula: Relative Market Share = SBU's Market Share / Largest Competitor's Market Share
- Example: If your SBU has 30% market share and the largest competitor has 20%, your relative market share is 1.5
4. Cash Flow Dynamics: Balancing Investment and Profit Generation
The cash flow is calculated using the balance sheet of the current financial year (total depreciation and provisions + net profit after tax and before potential redistribution of profits) and indicates the financial autonomy of the company.
Cash flow patterns:
- Stars: High investment, high returns
- Cash Cows: Low investment, high returns
- Question Marks: High investment, uncertain returns
- Dogs: Low investment, low returns
Strategic implications. The matrix suggests using profits from Cash Cows to fund the growth of Stars and carefully selected Question Marks. This approach aims to create a self-sustaining portfolio that balances current profitability with future growth potential.
5. Advantages of the BCG Matrix: Long-Term Vision and Resource Allocation
The BCG growth-share matrix allows managers to gain a clear long-term vision of the different SBUs.
Strategic insights. The matrix provides a visual representation of a company's portfolio, helping managers:
- Identify which SBUs to invest in, maintain, or divest
- Understand the different development needs of each SBU
- Allocate resources more effectively across the portfolio
Balanced portfolio. By encouraging a mix of SBUs across different quadrants, the matrix promotes a balanced approach to portfolio management, ensuring both short-term profitability and long-term growth potential.
6. Limitations: Oversimplification and Subjective Interpretation
While it is true that this model provides a good overall idea of the positioning of each SBU, we cannot be certain that, once categorised, all activities will automatically follow the path described above.
Oversimplification. The matrix reduces complex market dynamics to two dimensions, potentially overlooking important factors such as:
- Competitive landscape
- Regulatory environment
- Technological disruption
Subjectivity. Defining markets and calculating market share can be subjective, leading to potential misclassification of SBUs.
Static view. The matrix provides a snapshot in time and doesn't account for rapidly changing market conditions or disruptive innovations.
7. Complementary Models: McKinsey's GE Matrix and Ashridge Portfolio Matrix
By using these new matrices, the manager can consider certain factors relating to the attractiveness of the market which are neglected by the growth-share matrix.
McKinsey's GE Matrix:
- Considers broader market attractiveness beyond growth rate
- Evaluates competitive strength more comprehensively than market share alone
- Offers more nuanced recommendations with a 3x3 grid
Ashridge Portfolio Matrix:
- Focuses on management's ability to understand and improve SBU performance
- Categorizes SBUs based on parental fit and feel
- Helps identify which SBUs are truly suitable for the organization
Using these complementary models alongside the BCG matrix can provide a more comprehensive view of portfolio management decisions.
8. Practical Application: Defining Markets and Anticipating SBU Evolution
It is therefore important to complete a BCG growth-share matrix which outlines the different possible scenarios for each SBU.
Defining markets:
- Avoid overly narrow or broad market definitions
- Consult market specialists for accurate market boundaries
- Consider potential substitutes and emerging competitors
Anticipating SBU evolution:
- Innovation path: Direct entry as a Star through R&D investment
- Follower path: Question Mark to Star through strategic investment
- Disaster path: Star to Dog due to underinvestment or market changes
- Mediocrity path: Question Mark stagnating between Dog and Question Mark
Regularly update the matrix to reflect changing market conditions and SBU performance.
9. Case Study: Applying the BCG Matrix to a Diversified Conglomerate
The use of the BCG growth-share matrix allows managers to gain clarity choices relating to acquisition, and to the investment and development of SBUs.
Portfolio analysis:
- Cash Cows: Established airlines generating steady profits
- Stars: Entertainment and media divisions requiring ongoing investment
- Question Marks: New ventures like space tourism and finance
- Dogs: Underperforming divisions, such as the railway company
Strategic implications:
- Use profits from successful airlines to fund high-potential ventures
- Carefully manage investment in entertainment and media to maintain market position
- Evaluate Question Marks regularly, deciding which to support and which to divest
- Consider exiting or restructuring underperforming divisions
This case study demonstrates how the BCG matrix can guide resource allocation and portfolio management decisions in a complex, diversified business.


Download PDF
Download EPUB
.epub digital book format is ideal for reading ebooks on phones, tablets, and e-readers.


