
Key Takeaways
Price alone lies; volume is the lie detector markets cannot hide
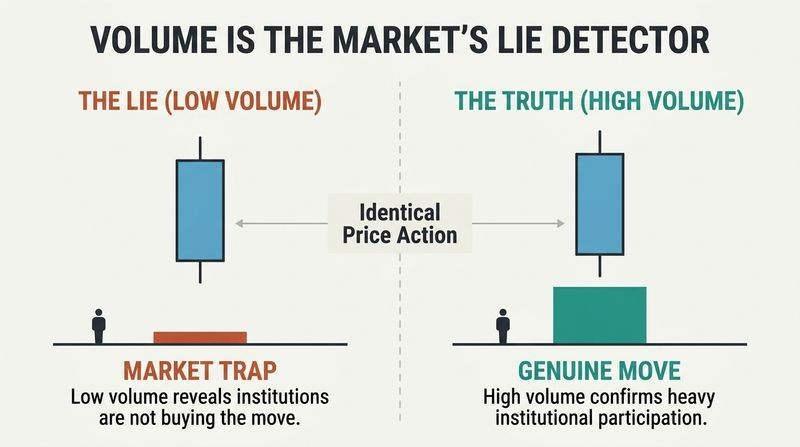
Two leading indicators, one truth. Coulling argues that of all trading signals, only two genuinely lead the market: price and volume. Price tells you where the market went. Volume tells you whether that move was real or a trap engineered to suck you in. Combine them and you get Volume Price Analysis (VPA), her own term for reading the relationship between effort (volume) and result (price).
Why volume cannot be faked. Markets are manipulated everywhere, by stock market makers, central banks in forex, and big operators in futures. But manipulators can disguise almost anything except the footprint of their own activity. A wide bullish candle on feeble volume is a warning, not a buy signal. Volume reveals when the professional money is genuinely participating versus quietly stepping aside.
The claim that volume is uniquely honest deserves scrutiny. In equities, off-exchange dark pools and after-hours prints hide large blocks, a limitation Coulling acknowledges. In spot forex there is no centralized volume at all, only tick counts as a proxy. So volume is less a perfect lie detector than the best available one. Still, the underlying logic echoes auction market theory and order-flow analysis used by institutional desks: meaningful price moves require participation. Academic microstructure research broadly supports that volume confirms price trends, the same intuition Charles Dow formalized over a century ago.
You are trading against licensed insiders; learn to follow their footprints
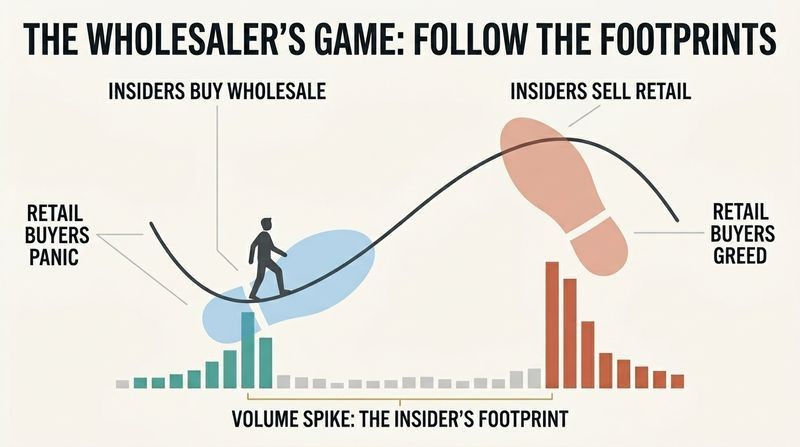
The market is a wholesaler's game. Coulling, borrowing from Richard Ney, frames market makers as merchants who buy stock at wholesale and sell at retail. They see both sides of the order book, set prices, and use every news headline to trigger fear or greed in retail traders. Her Parable of Uncle Joe illustrates this: a widget seller spreads a rumor of shortage to drive buying and raise prices, then leaks news of a competitor to spark panic selling so he can buy back cheap.
Don't fight them, shadow them. The goal of VPA is not to outsmart the insiders but to detect when they are buying or selling and ride their coattails. Buy when they buy, sell when they sell. Volume is the only window into their activity.
The conspiratorial framing will alienate some readers, and Coulling preempts this by insisting she is not a conspiracy theorist. The nuance matters: she is not claiming a secret cartel, but that thousands of market makers independently see the same supply-demand imbalances and act similarly. That is closer to emergent herd behavior than collusion. Behavioral finance supports her psychological core: retail traders systematically buy tops and sell bottoms, driven by loss aversion and fear of missing out. Whether one accepts the villain narrative or not, the actionable insight, that smart money leaves volume tracks, stands on its own.
Match effort to result; mismatches between volume and price ring alarms
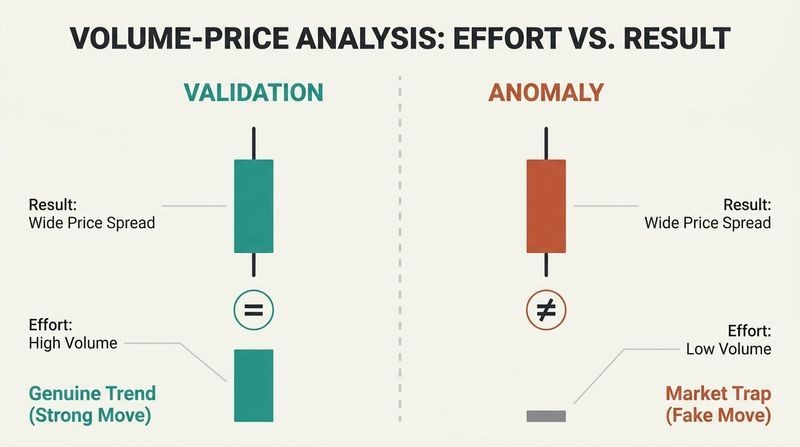
Wyckoff's three laws underpin everything. Coulling builds VPA on Richard Wyckoff's century-old principles: supply and demand move price; cause must precede effect (and the size of the cause dictates the size of the move); and effort must equal result. That third law is the daily workhorse. The effort is the volume bar; the result is the price spread of the candle.
Validation versus anomaly. Every candle gets one question: does volume agree with price? A wide bullish candle on high volume is validation, the move is genuine. A wide bullish candle on low volume is an anomaly, the alarm bell. So is a narrow candle on huge volume, which signals hidden selling absorbing the buying. You are forever scanning for just these two states: agreement or contradiction.
Reducing analysis to a single binary, validation or anomaly, is pedagogically elegant and cognitively manageable, which is its strength. The effort-equals-result heuristic resembles physics analogies (Newton's third law, which Coulling invokes) but is really probabilistic, not deterministic. A high-volume narrow candle does not guarantee reversal; it raises the odds. The risk is confirmation bias: a determined analyst can label almost any bar an anomaly in hindsight. Coulling's safeguard is insisting on subsequent confirmation across multiple candles and timeframes before acting, which disciplines the interpretation and separates VPA from pure pattern-matching superstition.
Markets cycle through accumulation and distribution like a warehouse filling and emptying
The insiders' campaign. Coulling describes a repeating cycle. In the accumulation phase, insiders quietly fill their warehouse, buying cheap stock from panicked sellers shaken out by bad news. They then mark prices up slowly, building confidence. At the top comes the distribution phase, where they unload inventory to greedy buyers terrified of missing out.
Climaxes mark the turns. The buying climax (her terminology) ends accumulation at a market bottom, on ultra-high volume as insiders gorge. The selling climax ends distribution at a top, also on high volume, as they dump stock. Between phases, insiders run tests: a deliberate push lower on low volume confirms selling is exhausted and the coast is clear to rally. These patterns repeat in every timeframe, from tick charts to monthly charts, like nested Russian dolls.
Coulling's labeling inverts common usage, calling the bottom a buying climax and the top a selling climax because she writes from the insider's perspective. This is confusing but internally consistent. The warehouse metaphor is genuinely useful for visualizing why moves take time: you cannot offload millions of shares in one print without crashing your own price, a real constraint confirmed by Nick Leeson's Barings collapse. The fractal claim, that cycles nest across all timeframes, is bold and unfalsifiable in the strong form, but it usefully reminds traders that context depends entirely on which doll, which timeframe, they are examining.
Three candles reveal everything: the shooting star, hammer, and long-legged doji
Read the wick first. Coulling's premier candles each tell a sentiment story. The shooting star (a long upper wick, small body) shows buyers pushed up then got overwhelmed by sellers: weakness. The hammer (long lower wick) shows sellers driven down then crushed by buyers: strength, often hammering out a bottom. The long-legged doji (long wicks both sides, open and close nearly equal) signals indecision and possible reversal.
Volume sets the volume of the signal. A shooting star on low volume is a minor pause; on ultra-high volume it screams insider selling. Crucially, shooting stars and hammers can never be anomalies, the price action speaks for itself, but a long-legged doji on low volume IS an anomaly, typically a stop-hunting whipsaw around news like Non Farm Payroll, not a genuine turn.
Coulling wisely refuses to write yet another candlestick encyclopedia, isolating three high-value patterns instead. This restraint is sound: research on candlestick predictive power is mixed at best, and most patterns add noise. By insisting candles mean nothing without volume context and trend location, she sidesteps the common failure mode where novices trade a hammer in isolation. The long-legged doji insight is especially practical: violent two-sided price action on thin volume during scheduled news is manufactured volatility designed to trigger stops, a phenomenon any forex trader who has watched a payroll release viscerally recognizes.
The market is an oil tanker; reversals take time, so be patient
Signals warn, they don't trigger. Coulling's hardest-learned lesson: a single reversal candle does not mean enter now. Markets have momentum and rarely turn on a dime. She uses the image of a summer rain shower that peters out gradually, or a spill needing a second pass to mop up. Insiders must absorb the last stubborn sellers (or buyers) before reversing, which creates the sideways whipsaw of congestion zones.
Wait for confirmation. Her early mistakes came from acting on the first hammer or stopping volume and getting stopped out as the market drifted further. The discipline is to treat a signal as a cue to watch the next few candles and check other timeframes, not as a buy button. The longer the consolidation (the cause), the larger the eventual move (the effect).
This is arguably the book's most valuable practical lesson and the least glamorous. The gap between recognizing a setup and the market actually turning destroys impatient traders. Coulling's tanker metaphor maps onto a real mechanism: large positions cannot be unwound instantly without adverse price impact, so accumulation genuinely takes time. The behavioral trap she describes, jumping in early on excitement, reflects the action bias documented across decision-making research, the urge to do something rather than wait. Patience as edge is counterintuitive in a culture that equates trading with constant activity, yet it aligns with how professional position-builders actually operate.
Support and resistance are crowds of trapped traders, not magic price lines
Floors and ceilings, like a house. When price oscillates sideways, it builds a floor of support and a ceiling of resistance. Coulling explains why these matter psychologically: at each wave, buyers get trapped at the top in losing positions and sell out in relief on the next bounce, while fresh buyers enter at the bottom. This recycling of fear and greed creates densely populated price zones that act as barriers on future visits.
Breakouts need volume. When price finally breaks a ceiling on strong, rising volume, it is genuine, and that old ceiling becomes a new floor of support and natural protection for a stop loss. A breakout on low volume is a fake-out, an insider trap. Spotting congestion in real time uses isolated pivots: three-candle patterns that define the floor and ceiling as they form.
Coulling's explanation of why support and resistance work, grounded in trapped-trader psychology rather than mystical numerology, is more rigorous than most technical-analysis treatments. It connects to prospect theory: traders hold losers hoping to break even (the disposition effect), creating the selling pressure that forms resistance. The self-fulfilling-prophecy angle she raises is real too: when enough participants watch the same levels, their collective action reinforces them. The honest caveat she offers, that these lines are rubber bands not steel rods, guards against the over-precision that leads traders to place stops exactly where everyone else does, precisely where insiders hunt them.
Build trend lines dynamically with pivots, entering at the start not the end
The textbook trend trap. Coulling dismisses the standard advice to wait for three higher highs and higher lows before drawing trend lines. By then the trend is mature, you are buying as insiders distribute. Static trend lines are easy to draw in hindsight and nearly useless live.
Pivots as waypoints. Instead, she builds trend lines forward in real time. After a volume-validated breakout from congestion, she watches for an isolated pivot high, then a pivot low, then the next pivot high (which must exceed the previous one to confirm an uptrend). Each pivot becomes a roadmap marker confirming the trend continues and giving the confidence to hold. If pivots fail to form on solid volume, the trend lacks momentum and likely fizzles back into congestion. This gets you in early, near the spawning ground where trends are born.
The critique of lagging trend identification is fair and widely shared: by the time a trend is textbook-obvious, much of the move is gone. Anchoring entries to congestion breakouts rather than established trends is a reasonable attempt to front-run the move. The weakness is survivorship in the examples: breakouts fail frequently, and the book's annotated charts naturally showcase clean successes. The discipline of demanding rising volume and well-formed pivots is the real filter, screening out low-conviction breaks. Traders should pair this with strict stops below the breakout level, which Coulling endorses, since even validated breakouts reverse more often than chart hindsight suggests.
Slice the volume bar open with Volume at Price to map hidden barriers
VAP versus VPA. Volume Price Analysis studies the linear relationship between a candle's volume and its price over time. Volume at Price (VAP) does something different: it shows a horizontal histogram of how much volume traded at each price level, revealing where buying and selling concentrated. Coulling describes it as cutting open the volume bar to see whether activity clustered at the top (likely selling) or bottom (likely buying).
Spotting significant zones visually. On a Microsoft chart, VAP exposed that a one-day congestion zone held almost as much volume as an earlier three-day zone, flagging it as a powerful support or resistance level. VAP makes the invisible barriers of support and resistance literally visible, but Coulling insists it supplements VPA, never replaces it. Most charting platforms now offer it free.
VAP is the retail-accessible cousin of institutional volume profile and market profile analysis, tools floor traders and quants use to identify high-volume nodes and value areas. The logic, that prices where heavy volume transacted become magnets and barriers, is well established in modern order-flow trading. Coulling's contribution is integrating it as a confirming layer rather than a standalone system. The inferential leap she makes, that volume clustered low means buying and high means selling, is a useful heuristic but imperfect; large transactions have both a buyer and seller, and intent is genuinely ambiguous without bid-ask delta data, which she touches on as an emerging technique.
Triangulate across three timeframes to gauge a trade's true risk
The three-lane highway. Coulling never reads one chart in isolation. Her forex setup uses 5, 15, and 30 minute charts, taking trades on the middle one. The faster chart is the fast lane showing early changes; the slower chart is the slow lane revealing the dominant trend. A single candle on the 30 minute chart might appear as two candles on the 15 minute and six on the 5 minute, making weakness far easier to spot on the slower frame.
Risk lives in the dominant trend. If your trade aligns with the dominant trend of the slower chart, risk is lower and you can hold longer. Trading against it is counter-trend trading: higher risk, shorter duration. Changes ripple from fast to slow timeframes like ripples in a pond; when a shift reaches the slowest chart, the resulting trend has the most momentum.
Multiple-timeframe analysis is a professional staple, and Coulling's framing of it as risk quantification rather than mere confirmation is the sophisticated part. The insight that a hard-to-read single candle becomes obvious when decomposed across timeframes is genuinely useful, exploiting how aggregation hides information. The ripple metaphor captures trend cascade reasonably, though it can encourage overfitting: with three charts a trader can always find one that supports a desired bias. The strongest discipline here is defining the dominant trend first, on the slowest chart, then only taking lower-timeframe entries in that direction, which structurally biases trades toward the path of least resistance.
VPA is an art that resists software; consistency beats data accuracy
No algorithm can do this. Coulling insists VPA cannot be automated. The analysis is subjective: comparing each volume bar against its history, judging whether it is low, average, or high relative to context, weighing it against trend position. Software lacks this judgment, which is why she warns against spending thousands on systems promising automated volume signals. It took her six months of daily chart study to become fluent.
Relative, not absolute. A liberating corollary: stop obsessing over data quality. In spot forex, tick volume is only about 90% representative of true activity, and feeds differ between brokers. Coulling argues this does not matter. Because you always compare bars on the same feed against each other, you are comparing imperfect data with imperfect data. Consistency of source trumps accuracy. The auction analogy makes the case: activity and price interest are inseparable.
The claim that VPA resists automation sits uneasily in 2024, when machine learning models routinely ingest order-flow and volume features. A fairer reading is that VPA as Coulling teaches it, holistic discretionary judgment, resists naive rule-based coding, which is true of most discretionary methods. Her relativity argument is statistically sound and underappreciated: for comparative analysis, systematic bias cancels out as long as the measurement is consistent, the same reason index-relative performance can be meaningful despite flawed absolute figures. The six-month apprenticeship she describes is an honest counterweight to the book's marketing-style promises of banishing emotion and forecasting markets with confidence.
Analysis
This is a practitioner's manual dressed as a manifesto, blending technical instruction with a populist narrative about insiders versus retail traders. Structurally it builds from first principles (why volume, why price) toward synthesis (multiple timeframes, chart examples), making it a framework-based how-to rather than a thesis-driven argument. Coulling's central claim is genuinely old: she is repackaging Wyckoff, Dow, Livermore, and Ney for the electronic era, and she says so openly, which is both intellectually honest and a tacit admission that her originality lies in synthesis and terminology (VPA, VAP) rather than discovery.
The book's greatest strength is conceptual unification. By reducing all analysis to one question, does volume validate price or contradict it, she gives novices a usable mental model where most technical-analysis texts drown readers in disconnected patterns. The warehouse and Uncle Joe metaphors make market microstructure intuitive. The patience lesson and the relativity-of-volume argument are the kind of hard-won practical wisdom that separates working traders from book-learners.
The weaknesses are equally clear. The insider-manipulation framing, while psychologically motivating, risks fostering an adversarial worldview that explains every loss as a trap rather than a probabilistic outcome. The book makes unfalsifiable claims (cycles exist in all timeframes; volume reveals everything) and leans on hand-picked annotated charts where hindsight makes signals look cleaner than live trading allows. Promises to banish emotion forever and forecast markets with confidence are marketing overreach inconsistent with the book's own admission that VPA is a probabilistic art requiring months of practice.
For the right reader, a beginner overwhelmed by indicators, this offers a coherent, low-cost philosophy: watch two variables, respect context, wait for confirmation, and follow the money. Its enduring value is less the specific signals than the disciplined habit of asking whether market behavior is being paid for by genuine participation. That question is worth carrying into any market.
Review Summary
A Complete Guide To Volume Price Analysis receives mixed reviews. Many praise its insights into volume-price relationships and market maker behavior, finding it valuable for improving trading strategies. Readers appreciate the focus on volume as a crucial indicator. However, some criticize the writing style as repetitive and poorly organized. The book is seen as beneficial for beginners but potentially lacking depth for experienced traders. Overall, readers find the concepts useful but express varying opinions on the presentation and depth of content.
People Also Read


Glossary
Volume Price Analysis (VPA)
Reading volume against price actionCoulling's own term for analyzing the relationship between volume and price on a chart to determine whether a move is genuine or false. The core method asks one question of every candle: does the volume confirm (validate) the price action, or contradict it (anomaly)? It applies to any market and any timeframe, from tick charts to monthly charts.
Volume at Price (VAP)
Horizontal histogram of volume by levelA technique displaying volume as a horizontal histogram showing how much trading occurred at each price level, rather than over each time period. It reveals concentrations of buying and selling, making support and resistance zones visually obvious. Coulling treats it as a supplement to VPA, useful for confirming the depth of congestion areas, never a replacement.
Validation versus anomaly
Volume agrees or contradicts priceThe binary diagnostic at the heart of VPA. Validation means volume confirms the price action (for example, a wide candle on high volume), signaling a genuine move. An anomaly means volume contradicts price (a wide candle on low volume, or a narrow candle on high volume), signaling a possible trap or impending reversal that warrants caution.
Accumulation and distribution
Insiders filling, then emptying inventoryThe two phases of the market cycle. In accumulation, insiders buy cheaply from panicked sellers near a bottom, filling their warehouse. In distribution, they sell to greedy buyers near a top, emptying it. Borrowed from Wyckoff and Dow, these phases repeat across all timeframes and are detectable through volume.
Buying climax and selling climax
High-volume turning points (insider perspective)Coulling defines these from the insider's viewpoint, inverting common usage. A buying climax marks a market bottom where insiders buy heavily on ultra-high volume, ending accumulation. A selling climax marks a top where insiders dump inventory on high volume, ending distribution. Both appear as high-volume turning points preceding a trend reversal.
Testing
Low-volume check for exhausted supplyA deliberate insider tactic of pushing price into a recent congestion zone, usually on minor news, to gauge remaining supply or demand. If volume stays low, the selling (or buying) has been absorbed and the market is safe to move; a high-volume test fails, forcing insiders to absorb more before continuing.
Stopping volume
Insider buying braking a fallThe footprint of insiders entering to halt a falling market, appearing as candles with deep lower wicks on rising volume over several sessions. Like braking an oil tanker, it takes time. It signals impending strength and often precedes a buying climax and reversal higher.
Isolated pivot
Three-candle reversal markerA three-candle pattern used to define congestion boundaries and build trend lines in real time. A pivot high has a center candle with a higher high and higher low than its neighbors; a pivot low is the inverse. Pivots act as roadmap waypoints, confirming a developing trend or a congestion zone as it forms.
FAQ
What's A Complete Guide To Volume Price Analysis about?
- Focus on Trading Success: The book emphasizes using Volume Price Analysis (VPA) to enhance trading success by understanding market movements.
- Key Indicators: It highlights price and volume as the only leading indicators in trading, offering insights into market behavior when combined.
- Emotional Trading Solutions: Anna Coulling aims to help traders eliminate emotional decision-making, promoting confidence and logic in trading.
Why should I read A Complete Guide To Volume Price Analysis?
- Expertise from Experience: Authored by Anna Coulling, with over 16 years of trading experience, offering practical insights and tested strategies.
- Universal Application: The methods can be applied across various markets, including stocks, forex, and commodities, making it versatile for traders.
- Educational Focus: Suitable for both novice and seasoned traders, providing foundational knowledge and advanced VPA techniques.
What are the key takeaways of A Complete Guide To Volume Price Analysis?
- Understanding Market Dynamics: Learn to interpret the relationship between price and volume to forecast market movements effectively.
- Elimination of Emotional Trading: Techniques to trade without emotions, focusing on logic and analysis.
- Historical Context: Insights into how iconic traders like Charles Dow and Jesse Livermore used similar methods, reinforcing VPA's timelessness.
What is Volume Price Analysis (VPA)?
- Definition of VPA: A method combining price and volume to analyze market behavior and predict future price movements.
- Key Components: Focuses on whether price movements are validated by corresponding volume, identifying anomalies for potential reversals.
- Practical Application: Applicable to any market and timeframe, making it a flexible tool for traders.
How does VPA help in eliminating emotional trading?
- Logic Over Emotion: Data-driven analysis of price and volume allows decisions based on logic rather than fear or greed.
- Confidence Building: Understanding market signals through VPA helps traders feel more secure, reducing stress and anxiety.
- Structured Approach: Provides a systematic method for analyzing trades, maintaining discipline and focus.
What are the principles of Volume Price Analysis?
- Art Not Science: VPA is an art form requiring subjective analysis, adaptable to individual trading styles.
- Validation or Anomaly: Look for validation of price movements by volume or anomalies signaling potential market direction changes.
- Relative Volume Analysis: Volume is relative; compare current volume against historical data to gauge market strength.
What is the significance of accumulation and distribution phases in VPA?
- Market Behavior Understanding: Accumulation is when insiders buy stock, while distribution is when they sell at higher prices.
- Emotional Triggers: Driven by fear and greed, insiders manipulate market sentiment to maximize profits.
- Cycle Repetition: These phases repeat across all timeframes, providing a framework for anticipating market movements.
How do tests of supply and demand work in VPA?
- Testing Mechanism: Insiders test to determine if all selling or buying pressure is absorbed before moving the market.
- Low Volume Tests: Successful tests show low volume, indicating few sellers or buyers left, allowing insiders to proceed.
- High Volume Tests: Failed tests with high volume indicate significant pressure, requiring strategy adjustments.
How do candlestick patterns relate to VPA?
- Key Candlestick Patterns: Patterns like the shooting star and hammer signal potential market reversals or continuations.
- Volume Context: Analyzing patterns alongside volume provides a clearer picture of market dynamics.
- Practical Examples: Examples show how these patterns can be identified and interpreted in real-time trading scenarios.
What is the significance of support and resistance in trading?
- Market Behavior Indicators: Support and resistance levels indicate where price action may pause or reverse, aiding entry and exit points.
- Psychological Levels: Often psychological barriers where traders have previously entered or exited positions, critical for future price action.
- Volume Validation: Breakouts from these levels should be validated by volume to confirm move strength.
How can I apply VPA in my trading?
- Analyze Volume and Price: Observe the relationship between volume and price, looking for anomalies and patterns signaling potential trades.
- Use Multiple Time Frames: Employ multiple time frames for a broader perspective on market trends and validate analysis.
- Practice with Real Examples: Apply concepts to real market scenarios, using historical data to practice identifying VPA signals and patterns.
What are the best quotes from A Complete Guide To Volume Price Analysis and what do they mean?
- "Volume validates price.": Emphasizes that price movements should be supported by corresponding volume to be significant.
- "The market does not run on chance or luck.": Highlights the importance of analysis and strategy, suggesting success comes from informed decision-making.
- "VPA is an art and not a science.": Reflects the subjective nature of trading, where intuition and experience play crucial roles alongside analytical techniques.
About the Author
Other books by Anna Coulling

Download PDF
Download EPUB
.epub digital book format is ideal for reading ebooks on phones, tablets, and e-readers.


