Key Takeaways
Candlesticks are the market's language, mapping the war between fear and greed
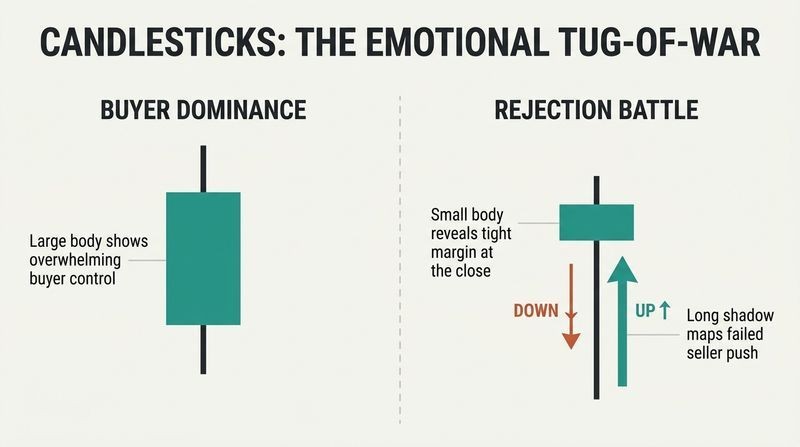
Charts speak; learn to read them. The book frames Japanese candlesticks as a visual language invented by rice trader Munehisa Homma in 1700s Japan, who reportedly recognized that emotion, not just supply and demand, sets price. A single candlestick encodes four data points: open, high, low, and close. The body shows the open-to-close range; the thin wicks (shadows) mark the session's extremes.
Body and shadow tell a story. A long body signals strong conviction (buyers or sellers dominating), while a short body signals indecision. A long lower shadow means sellers pushed price down but buyers fought back; a long upper shadow means the reverse. Reading these shapes reveals who is winning the tug-of-war between bulls and bears in real time.
What's compelling is the reframing of price charts as crowd psychology made visible, an idea that predates modern behavioral finance by three centuries. Homma intuited what Kahneman and Tversky later formalized: humans trade on emotion, not pure rationality. Yet the romantic origin story deserves skepticism. The widely cited $10 billion fortune is unverifiable folklore, and academic studies of candlestick predictive power (notably Marshall, Young, and Rose, 2006) found little profitability in isolation. The honest claim here is narrower: candlesticks describe sentiment well, but description is not prediction. Treat them as a vocabulary for reading market mood, not a crystal ball.
Master a handful of reversal patterns before touching a live account
Patterns repeat because human behavior repeats. The book catalogs the core candlestick formations and the psychology each encodes:
1. Engulfing bar: a second candle fully swallows the first, signaling one side has seized control.
2. Doji: open equals close, a cross shape meaning total indecision and a possible trend exhaustion.
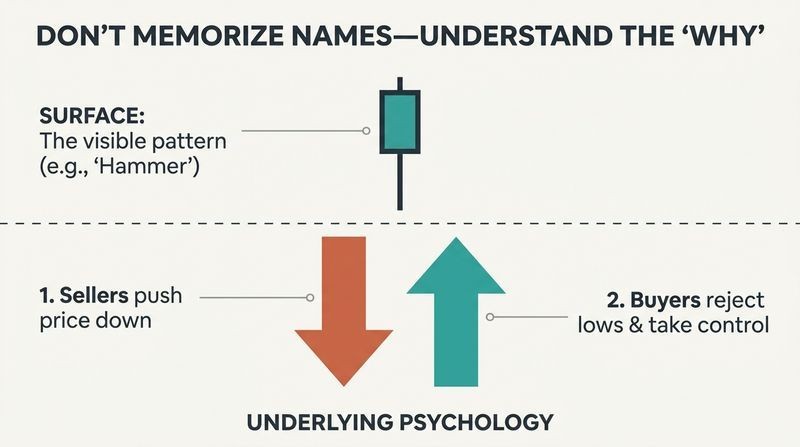
3. Hammer and shooting star: small bodies with one long tail, showing rejection of lower or higher prices.
4. Morning and evening star: three-candle reversals marking bottoms and tops.
5. Harami and tweezers: two-candle consolidation or reversal signals.
Memorize the why, not the name. The author insists the trader's job is to understand why a pattern formed (who got rejected, who took control), because that understanding lets you predict the next move rather than blindly matching shapes.
The pedagogy here is sound: chunking. Cognitive science shows experts perceive meaningful patterns where novices see noise, exactly what chess grandmasters do with board positions. By forcing learners to internalize the psychology behind each formation rather than rote-memorize names, the author builds transferable pattern recognition. The weakness is selection bias in the examples. Every illustrated chart shows the pattern working beautifully, a textbook hazard. Real charts are littered with hammers that failed and dojis that resolved into continuation. The remedy the book itself eventually prescribes, confluence and confirmation, is the honest correction to pattern-matching's seductive but incomplete promise.
Every chart is trending, ranging, or choppy; never trade the choppy one
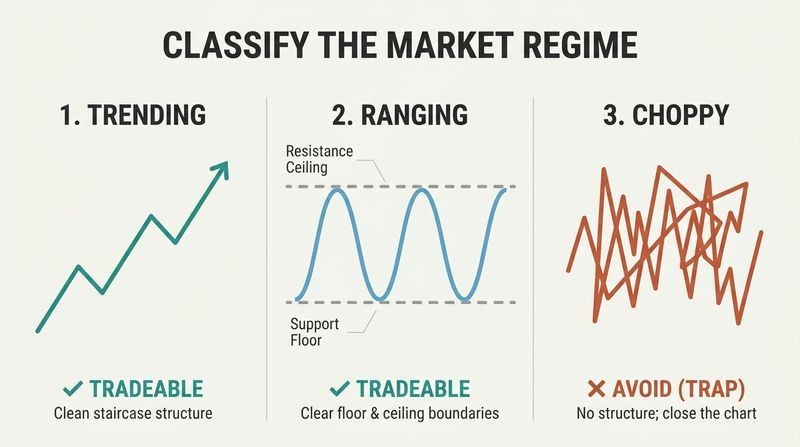
Classify before you strategize. The book's market structure framework reduces all price action to three regimes:
1. Trending: a staircase of higher highs and higher lows (uptrend) or lower highs and lower lows (downtrend).
2. Ranging: price bounces horizontally between a support floor and resistance ceiling.
3. Choppy: directionless noise with no identifiable boundaries.
Choppy markets are traps. The author is blunt: when you zoom out on the daily chart and cannot draw clean support or resistance, close the chart and walk away. Trading chop gives back profits because markets consolidate after big moves. He notes trends occur only around 30% of the time, so patience matters. Crucially, judge structure on bigger time frames (4-hour, daily, weekly), never on the noisy 5-minute.
This regime-classification instinct mirrors how quantitative funds deploy different models for trending versus mean-reverting conditions; misapplying a trend-following strategy in a range is a classic blowup. The discipline of sitting out chop is psychologically harder than it sounds. Behavioral research on action bias shows humans (and goalkeepers facing penalty kicks) feel compelled to do something rather than wait, even when waiting is optimal. The book's prescription to simply close the chart is a commitment device against this urge. One nuance worth adding: regime boundaries are fuzzy and only obvious in hindsight, which is why the author leans so heavily on multiple time frame confirmation.
Buy the impulsive move's start, never the retracement that traps amateurs
Trends breathe in two motions. The author splits trend movement into the impulsive move (the strong thrust in the trend's direction) and the retracement or pullback (the corrective drift backward). Professionals enter at the beginning of impulsive moves and take profit at their end. Amateurs who buy during a retracement get their stops hunted before price resumes.
Use levels to time the impulse. To catch the impulsive move's start, draw support and resistance from prior swing points: in an uptrend, the old swing high becomes new support; in a downtrend, the old swing low becomes resistance. Trendlines drawn by connecting at least two swing points serve the same purpose. When price pulls back to these levels and shows a reversal candle, the next impulse is likely beginning.
The impulse-retracement vocabulary echoes Elliott Wave and Wyckoff theory, both of which model markets as rhythmic accumulation and distribution. The actionable insight, enter at levels where the pullback exhausts, is genuinely useful risk management because it places stops at logical invalidation points. However, the framing of retracement buyers as naive victims of professionals oversimplifies. Plenty of profitable strategies (momentum breakout systems) deliberately buy strength, not pullbacks. The deeper truth is that entry timing must match exit logic and stop placement; the pullback entry's real virtue is a tighter stop and better reward-to-risk, not moral superiority over other traders.
Trade only at trend, level, and signal alignment, like a sniper
Three questions before every trade. The book distills its entire method into a checklist you run when opening any chart:
1. The trend: is the market trending, ranging, or choppy? If choppy, leave.
2. The level: where are the most powerful support, resistance, supply, or demand zones?
3. The signal: is there a clean candlestick pattern (pin bar, engulfing bar, inside bar) firing at that level in the trend's direction?
Wait for setups to come to you. When trend, level, and signal converge, you have a high-probability trade. The author calls trading with multiple aligned factors confluence, and frames the ideal trader as a sniper who waits patiently for the perfect shot rather than firing at everything that moves.
The trend-level-signal triad is essentially a manual Bayesian filter: each aligned factor raises the posterior probability of success. This is the book's strongest contribution, converting fuzzy chart-reading into a repeatable decision rule that curbs overtrading, the documented killer of retail accounts (Barber and Odean found the most active traders underperformed the market by roughly 6.5 percentage points annually). The sniper metaphor is a useful identity anchor. The caveat: confluence can become confirmation bias dressed up as rigor. Stack enough indicators and you can justify any trade. The skill is defining your confluence factors in advance, not retrofitting reasons after spotting a candle you already want to trade.
Always check the weekly before trading the daily: top-down analysis
Zoom out before you zoom in. Top-down analysis means starting on the bigger time frame to grasp the big picture, then dropping to your trading time frame for entry. To trade the 4-hour chart, first read the weekly and daily; to trade the 1-hour, first read the daily. Only act when the time frames agree.
A vivid cautionary example. The book shows a clean bullish pin bar on the daily chart that screams buy. But the weekly chart reveals price slamming into a major resistance level with sellers rejecting it. A trader fixated on the daily buys and loses; the trader who checked the weekly sells with the bigger forces. The signal that looks perfect in isolation is often invalidated by the larger structure above it.
This fractal view of markets, the same patterns recurring at every scale, aligns with how institutional desks actually operate, setting directional bias on higher time frames and executing on lower ones. The pin-bar-into-weekly-resistance example is the book's most instructive moment because it shows a textbook signal failing for a structural reason, the rare honest acknowledgment that signals are context-dependent. One tension: more time frames can also produce analysis paralysis and conflicting signals, the so-called multiple time frame trap. The discipline is hierarchy, letting the higher frame veto the lower, rather than endlessly hunting for a frame that agrees with your bias.
The long tail is the whole story: pin bars mark rejection
A wick that screams rejection. A pin bar (the book's term for the hammer and shooting star family) is a candle with a tiny body and one long tail at least twice the body's length. The tail marks prices the market tested and violently rejected. A bullish pin bar has a long lower wick (sellers pushed down, buyers slammed it back up); a bearish pin bar has a long upper wick.
Filter ruthlessly. Not every pin bar is tradable. The author's filters: it must form on the 4-hour or daily (small frames generate false signals), align with the trend, sit at a key level, and have a genuinely long tail. Entry options are aggressive (immediately on close) or conservative (waiting for a 50% retracement of the bar for better reward-to-risk, sometimes exceeding 5:1).
The pin bar's logic is microstructure made visible: that long tail represents real orders absorbed and reversed, a footprint of large players defending a price. This is why the author insists on key levels, a rejection wick in no-man's-land means nothing. The aggressive-versus-conservative entry trade-off captures a genuine dilemma in execution: certainty of fill versus quality of price. Conservative entries improve reward-to-risk but suffer missed trades, while aggressive entries catch every move but at worse prices. There is no universally correct answer, which is why the author defers to screen time and experience, an honest admission that judgment, not rules alone, separates winners.
The inside bar false breakout weaponizes the stop-hunt against the hunters
Banks fish for your stop losses. An inside bar is a small candle entirely contained within the prior larger mother candle, signaling consolidation and indecision. Its most powerful variant is the false breakout: price breaks out of the inside bar, triggers the stops clustered there, then snaps back inside the mother bar's range. The author argues big institutions deliberately drive price to where retail stops sit, creating the liquidity they need to fill large orders.
Turn the trap into a trade. Rather than being the victim whose stop gets hunted, the educated trader recognizes the false breakout and enters in the reversal direction. Combined with a key level (resistance, the 50% or 61% Fibonacci retracement) the reward can be enormous, the book floats risking 50 points to make 400.
The stop-hunt thesis is partly folklore and partly real. Liquidity does cluster at obvious levels, and academic work on stop-loss clustering and price gravitation toward round numbers supports the mechanism. But attributing it to coordinated bank conspiracy overstates intentionality; much of it is simply emergent market structure, where everyone places stops in the same predictable spots. The practical wisdom survives regardless of the narrative: obvious stop placement is exploitable, so place stops where they are less crowded and treat failed breakouts as high-probability reversals. The false breakout is arguably the book's most sophisticated pattern because it trades against the herd's psychology rather than with it.
Risk 2:1 reward minimums and you can lose most trades yet profit
Math beats accuracy. The book's money management core is the risk-to-reward ratio: never enter a trade whose potential profit is less than twice the amount risked. The arithmetic is liberating. Take ten trades at 3:1, risking $200 to make $600 each. Lose seven, win three: you drop $1,400 but gain $1,800, netting $400 despite a 30% win rate.
Position sizing and survival rules. Successful traders risk no more than 2% of equity per trade (1% for beginners). Think in dollars risked, not pips. Always use a hard stop loss on the platform, never a mental one, because humans hate booking losses and will rationalize holding. And never trade money you cannot afford to lose, since fear corrupts execution.
This is the book's most universally valid and least glamorous lesson, and it deserves top billing. The insight that win rate is nearly irrelevant if reward-to-risk is favorable is the mathematical heart of all professional trading, poker, and venture capital alike. Ralph Vince's work on optimal position sizing and the Kelly criterion formalize what the author states intuitively: ruin probability, not hit rate, determines survival. The 2% rule is a crude but effective ruin-avoidance heuristic; risking 10% per trade means a string of five losses (statistically inevitable) cripples you. The hard-stop mandate also defends against the disposition effect, the documented tendency to ride losers and cut winners.
No system wins every trade; losing is the cost of admission
Abandon the holy grail fantasy. The author repeatedly insists this method, despite its title, is not a 100% winning system, and anyone seeking one should quit trading. Losses are structural, not failures. A signal failing does not mean the analysis was wrong; it means the market did not validate it this time, often because the capital sellers committed simply outweighed buyers. You accept the loss and look for the next opportunity.
Treat it as a skill, not a lottery. The closing argument reframes trading as a profession requiring years of deliberate practice, like earning a university degree. Screen time, journaling mistakes, and patience build mastery. The goal is to become an expert at the process; money follows competence rather than the reverse.
This probabilistic mindset is the psychological linchpin that makes the mechanical rules usable. Trader-turned-author Mark Douglas built entire books (Trading in the Zone) on this single idea: thinking in probabilities dissolves the emotional charge of any individual loss. The reframe connects to deliberate practice research from Anders Ericsson, though trading is a notoriously low-validity environment where feedback is noisy and luck masquerades as skill, making expertise far harder to build than in chess or music. The honest tension is that the book sells a method while disclaiming certainty, a necessary humility. The reader's real edge is not the patterns but the emotional discipline to execute them across a large sample.
Analysis
This is a practitioner's manual, not a work of finance theory, and it should be judged as such. Structurally it moves from vocabulary (candle anatomy and patterns) to grammar (market structure, support, resistance, time frames) to sentences (four trading strategies) to survival (money management). That progression is genuinely well-sequenced pedagogy, and the book's repeated insistence on mastering basics before strategies reflects sound learning design.
The intellectual core is stronger than the candlestick branding suggests. The real engine is not the exotic Japanese patterns but three universal pillars: trend alignment, trading at meaningful levels, and ruthless reward-to-risk discipline. Strip away the morning stars and gravestone dojis, and what remains is a coherent, conservative, trend-following methodology that any professional would recognize. The money management chapter, almost an afterthought by page count, is where the durable value lives.
The book's weaknesses are the genre's weaknesses. Every example chart is a winner selected in hindsight, creating survivorship illusion. The mythologized origin story (Homma's supposed $10 billion, his god-of-markets status) is unverifiable, and rigorous academic studies have generally found candlestick patterns weakly predictive in isolation. The stop-hunting conspiracy framing, while pedagogically motivating, anthropomorphizes emergent market behavior. There is no backtesting, no statistical edge quantification, no transaction-cost accounting.
Yet the author shows real intellectual honesty where it counts: explicitly rejecting the holy grail, insisting losing is structural, demanding probabilistic thinking, and warning beginners away from counter-trend trades and choppy markets. The deepest lesson is not any pattern but a temperament: patience, selectivity, predefined risk, and acceptance of uncertainty. Read as a disciplined framework for thinking about market psychology and capital preservation, it delivers. Read as a literal money-printing system, it would disappoint, which the author, to his credit, repeatedly warns against.
Review Summary
The Candlestick Trading Bible receives mostly positive reviews, with readers praising its comprehensive coverage of candlestick patterns and trading strategies. Many find it valuable for beginners and experienced traders alike, noting improved trading results after applying the book's teachings. Some reviewers highlight the book's historical context and its ability to simplify complex concepts. However, a few critics mention repetitive content and question the practical applicability of certain patterns. Overall, readers appreciate the book's detailed explanations and its potential to enhance trading skills.
People Also Read


FAQ
What's "The Candlestick Trading Bible" about?
- Overview: "The Candlestick Trading Bible" by Munehisa Homma is a comprehensive guide to trading using Japanese candlestick patterns combined with technical analysis.
- Historical Context: It introduces the history and development of candlestick charting, a method pioneered by Munehisa Homma, a successful Japanese rice trader.
- Trading System: The book presents a trading system that is designed to be consistent, profitable, and easy to follow, requiring minimal time and effort.
- Educational Focus: It emphasizes the importance of understanding market psychology and mastering candlestick patterns to make informed trading decisions.
Why should I read "The Candlestick Trading Bible"?
- Proven Strategies: The book offers strategies that have been proven to generate profits using Japanese candlestick patterns.
- Comprehensive Learning: It provides a detailed education on reading and interpreting candlestick charts, which are essential for trading in financial markets.
- Market Psychology: Understanding the psychology behind market movements is a key focus, helping traders make better decisions.
- Practical Application: The book is designed to be practical, with exercises and examples to help readers apply the concepts in real trading scenarios.
What are the key takeaways of "The Candlestick Trading Bible"?
- Candlestick Patterns: Learn to identify and interpret various candlestick patterns, such as the Engulfing Bar, Doji, and Hammer, which signal market trends and reversals.
- Market Structure: Understand how to identify trending, ranging, and choppy markets, and how to trade them effectively.
- Trading Strategies: The book outlines specific strategies like the Pin Bar and Engulfing Bar strategies, providing step-by-step guidance on their application.
- Money Management: Emphasizes the importance of risk management and developing a money management plan to protect trading capital.
What is the history of candlesticks according to "The Candlestick Trading Bible"?
- Origins: Candlestick charting originated in Japan in the 17th century, primarily used in rice trading.
- Munehisa Homma: Homma is credited with developing this method, understanding both supply and demand dynamics and market emotions.
- Western Adoption: Candlesticks were introduced to the Western world in the 1980s, gaining popularity due to their effectiveness in market analysis.
- Visual Representation: Candlesticks provide a visual representation of market activity, offering insights into price movements and trader psychology.
How does "The Candlestick Trading Bible" define a candlestick?
- Components: A candlestick is formed using the open, high, low, and close of a chosen time frame.
- Bullish vs. Bearish: If the close is above the open, the candlestick is bullish; if below, it is bearish.
- Real Body and Shadows: The filled part is the real body, while the lines above and below are shadows, indicating the high and low of the session.
- Body Sizes: Long bodies indicate strong buying or selling pressure, while short bodies suggest little activity.
What are the most important candlestick patterns in "The Candlestick Trading Bible"?
- Engulfing Bar: Indicates a potential reversal, with the second candle engulfing the first.
- Doji Patterns: Signify indecision in the market, often leading to reversals.
- Hammer and Shooting Star: Indicate potential reversals at the bottom or top of trends, respectively.
- Morning and Evening Stars: These are three-candle patterns that signal strong reversals.
How does "The Candlestick Trading Bible" suggest trading trending markets?
- Identify Trends: Look for higher highs and lows in uptrends, and lower highs and lows in downtrends.
- Impulsive and Retracement Moves: Trade at the beginning of impulsive moves, not during retracements.
- Support and Resistance: Use these levels to predict the start of impulsive moves.
- Trendlines: Draw trendlines to identify key support and resistance levels in trending markets.
What is the Pin Bar strategy in "The Candlestick Trading Bible"?
- Pin Bar Definition: A pin bar has a long tail and a small body, indicating rejection and a potential reversal.
- Trading with the Trend: Pin bars are most effective when traded in the direction of the prevailing trend.
- Key Levels: Look for pin bars at major support and resistance levels for high-probability setups.
- Entry Options: Enter aggressively after the pin bar closes or conservatively after a 50% retracement.
How does "The Candlestick Trading Bible" explain the Engulfing Bar strategy?
- Pattern Description: An engulfing bar consists of two opposite-colored bodies, with the second engulfing the first.
- Trend Reversal: A bullish engulfing pattern signals a reversal at the end of a downtrend, while a bearish one does so at the end of an uptrend.
- Trading with Levels: Combine engulfing bars with support and resistance levels for effective trading.
- Confluence: Use moving averages, Fibonacci retracements, and trendlines to confirm engulfing bar signals.
What is the Inside Bar strategy in "The Candlestick Trading Bible"?
- Pattern Definition: An inside bar consists of a smaller candle within the range of a larger mother candle.
- Reversal and Continuation: It can signal both reversals and continuations, depending on the market context.
- Trading with Trends: Best used in strong trending markets to join the trend after a pause.
- Support and Resistance: Use inside bars at key levels to confirm breakouts or reversals.
How does "The Candlestick Trading Bible" address money management?
- Risk/Reward Ratio: Emphasizes maintaining a risk/reward ratio of at least 1:2 to ensure long-term profitability.
- Position Sizing: Adjust position sizes based on account size and risk tolerance to manage exposure.
- Stop Losses: Use protective stop losses to limit potential losses and manage risk effectively.
- Emotional Control: Encourages setting and forgetting trades to avoid emotional decision-making.
What are the best quotes from "The Candlestick Trading Bible" and what do they mean?
- "The trend is your friend": Emphasizes the importance of trading in the direction of the prevailing market trend for higher success rates.
- "Candlesticks are the language of financial markets": Highlights the significance of understanding candlestick patterns to interpret market movements.
- "Trading is a game of probabilities": Reminds traders that success is about managing probabilities, not certainties, and the importance of risk management.
- "If you can get this skill, you will change completely your life": Encourages mastering candlestick patterns and market psychology to achieve financial independence through trading.
Download PDF
Download EPUB
.epub digital book format is ideal for reading ebooks on phones, tablets, and e-readers.


