つの重要なポイント
1. データを視覚化する前に、対象読者とコンテキストを理解する
データには物語がある。しかし、その物語を知っているのはツールではなく、情報を視覚的かつコンテキストに沿って生き生きと伝えるアナリストやコミュニケーターである。
対象読者を知る。 データの視覚化に取り組む前に、対象読者が誰であり、彼らが何を知りたいのか、または何を行いたいのかを明確に特定する。この理解が、メッセージを作成する際のすべての決定に影響を与える。考慮すべき点は以下の通り:
- 特定の対象読者は誰か?(例:意思決定者、チームメンバー、クライアント)
- 彼らの主題に対する理解度はどの程度か?
- データを見た後に彼らにどのような行動を取ってほしいか?
目的を明確にする。 伝えたい主要なメッセージと、それをサポートするデータを特定する。以下のツールを活用する:
- 「ビッグアイデア」:主要なポイントを一文でまとめたもの
- 「3分間の物語」:メッセージの要点を捉えた簡潔な概要
- ストーリーボード:コンテンツの構造を確立するための視覚的なアウトライン
コンテキストを事前に理解することに時間を投資することで、対象読者に響き、行動を促す焦点の定まった効果的なデータ視覚化を作成することができる。
2. データとメッセージに適した視覚表示を選ぶ
答えは常に同じ:対象読者が最も読みやすいものを選ぶこと。
形式を機能に合わせる。 データの種類と伝えたい物語が、視覚表示の選択を導くべきである。以下の一般的なオプションを考慮する:
- 表:正確な値の検索や異なる単位の測定に最適
- 折れ線グラフ:時間の経過に伴う傾向を示すのに理想的
- 棒グラフ:カテゴリの比較に優れている
- 散布図:変数間の関係を示すのに有用
不要な複雑さを避ける。 シンプルなチャートの方が効果的なことが多い:
- 円グラフの使用を制限する。解釈が難しい場合があるため
- 3D効果を避ける。データの認識を歪める可能性があるため
- 二重軸チャートには注意を払う。混乱を招く可能性があるため
視覚表示の選択は、対象読者が主要な情報を迅速に把握しやすくするものであるべきだ。確信が持てない場合は、同僚と異なるオプションをテストして、どれが最も明確に伝わるかを確認する。
3. クラッターを排除して明確さと焦点を高める
視覚が必要以上に複雑に見える原因となるため。
徹底的に簡素化する。 視覚化のすべての要素には目的があるべきだ。理解に直接寄与しないものを特定し、削除する:
- グリッドライン(または非常に薄くする)
- 重複するラベル
- 過剰な小数点
- 装飾的なグラフィックや枠線
ホワイトスペースを戦略的に使用する。 キャンバスのすべてのインチを埋める必要はない。ホワイトスペースは:
- 重要な要素に注意を引くのに役立つ
- 視覚化を圧倒的に感じさせない
- 全体の読みやすさを向上させる
強調を通じて強調しない。 重要な要素を目立たせる代わりに、他のすべてを控えめにする。これにより、対象読者の焦点をより微妙かつ効果的に誘導できる。
クラッターを排除することで、対象読者の認知負荷を軽減し、データ視覚化から主要な洞察を迅速かつ容易に把握できるようにする。
4. 事前注意属性を活用して効果的に注意を引く
事前注意属性を戦略的に使用すれば、対象読者が見ていることに気づく前に、見てほしいものを見せることができる。
視覚的な手がかりを活用する。 事前注意属性は、意識的な注意を払う前に脳がほぼ瞬時に処理する視覚的特性である。これを使って重要な情報を強調する:
- 色:重要なデータポイントに注意を引くために控えめに使用する
- サイズ:重要な要素を大きくする
- 位置:目が自然に最初に見る場所(通常は左上)に重要な情報を配置する
- 形:カテゴリを区別するために異なる形を使用する
視覚的な階層を作成する。 事前注意属性を組み合わせて、情報を特定の順序で対象読者に伝える:
- 主要な焦点:最も強力な視覚的手がかりを使用する
- 二次情報:より微妙な区別を適用する
- コンテキスト:補足的な詳細を表示しつつも強調しない
色を意図的に使用する。 色は強力なツールだが、過度の使用はその効果を減少させる:
- 強調のために単一のアクセントカラーを選ぶ
- 視覚化全体で色を一貫して使用する
- 色覚異常に配慮したパレットを検討する
事前注意属性を戦略的に適用することで、対象読者の注意を誘導し、データストーリーを明確に伝える視覚的な道筋を作成することができる。
5. アクセシブルで美しい視覚化のためのデザイン原則を適用する
形は機能に従う。
アクセシビリティを優先する。 視覚化が幅広い対象読者にとって理解しやすいものであることを確認する:
- 明確で読みやすいフォントを使用する
- テキストと背景の間に十分なコントラストを提供する
- 説明的なタイトルとラベルを含める
- 情報を伝えるために色だけに頼らない
視覚的な魅力を作り出す。 美しいデザインは使いやすく、信頼性が高いと認識される:
- 要素を整列させて秩序感を作り出す
- 一貫したスタイリング(フォント、色、間隔)を使用する
- ホワイトスペースとコンテンツのバランスを取る
メディアを考慮する。 異なる形式に合わせてデザインを適応させる:
- プレゼンテーション:テキストが少ないシンプルな視覚化
- レポート:詳細な視覚化と補足説明
- インタラクティブなダッシュボード:探索を可能にしつつ、主要な洞察を導く
良いデザインは視聴者にとって自然に感じられるべきだ。対象読者がデザイン自体に焦点を当てるのではなく、コンテンツに集中できるように、さらに簡素化する必要があるかもしれない。
6. データを生き生きとさせるために魅力的な物語を作成する
データだけではなく、物語が私たちに共鳴し、記憶に残る。
物語の構造を作る。 古典的なストーリーテリングの要素を使用して対象読者を引き込む:
- 始まり:コンテキストを設定し、問題を紹介する
- 中盤:データと分析を提示する
- 終わり:洞察と行動を促す結論を述べる
緊張感を作り出す。 現状と望ましい結果のギャップを強調して興味を維持する:
- データが取り組む問題は何か?
- 対象読者が関心を持つ理由は何か?
- 何が改善されるべきか、または変更されるべきか?
物語の技法を使用する:
- 繰り返し:主要なポイントを強調する
- アナロジー:複雑な概念を身近なものにする
- 具体的な例:データを実世界の応用で生き生きとさせる
データは物語をサポートするものであり、物語そのものではないことを忘れないでください。「それでどうするのか」に焦点を当て、情報の重要性とそれが促すべき行動を強調する。
7. データストーリーを洗練するために反復とフィードバックを求める
データのコミュニケーションに関しては、新しい視点を得ることに大きな価値がある。
反復を受け入れる。 最初の試みが最良のものとは限らない。複数回の修正のための時間を計画する:
- 異なるアプローチを探るために迅速なドラフトを作成する
- 一度離れてから新たな視点で戻る
- 新しいアイデアがより効果的であることが証明された場合、最初からやり直すことをいとわない
多様なフィードバックを求める。 異なる視点が盲点を明らかにし、明確さを向上させる:
- 主題に精通した同僚
- 一般的な理解をテストするための異なる分野の人々
- 可能であれば、ターゲットオーディエンスのメンバー
理解度をテストする。 レビューアーに具体的な質問をする:
- 主要なメッセージは何だと思いますか?
- これを見た後にどんな質問がありますか?
- この情報に基づいて何を変えますか?
フィードバックから得た洞察を活用して視覚化と物語を洗練する。目標は効果的なコミュニケーションであり、完璧ではないことを忘れないでください。反復を通じた継続的な改善が、データストーリーテリングのスキルを向上させるのに役立ちます。
最終更新日:
FAQ
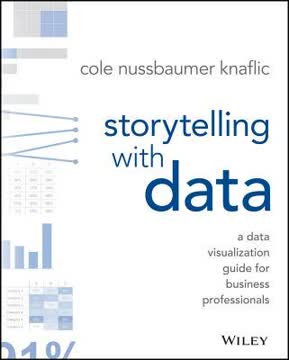
What's "Storytelling with Data" about?
- Purpose: "Storytelling with Data" by Cole Nussbaumer Knaflic is a guide for business professionals on how to effectively communicate data through visualization.
- Focus: The book emphasizes the importance of storytelling in data presentation, aiming to transform raw data into compelling narratives.
- Audience: It is written for anyone who needs to communicate data-driven insights, including analysts, managers, and leaders.
- Structure: The book is organized into lessons that cover understanding context, choosing visuals, eliminating clutter, focusing attention, thinking like a designer, and telling a story.
Why should I read "Storytelling with Data"?
- Improve Communication: It provides practical strategies to enhance your ability to communicate complex data clearly and effectively.
- Professional Edge: Mastering data storytelling can set you apart in the workplace, as it is a skill increasingly in demand.
- Broad Applicability: The lessons are applicable across various industries and roles, making it a versatile resource.
- Engaging Content: The book is filled with real-world examples and case studies that make the concepts relatable and easy to understand.
What are the key takeaways of "Storytelling with Data"?
- Understand Context: Before visualizing data, know your audience and what you want them to learn or do.
- Choose Effective Visuals: Select the right type of graph or chart to best convey your message.
- Eliminate Clutter: Remove unnecessary elements that do not add value to your data visualization.
- Tell a Story: Use narrative techniques to make your data more engaging and memorable.
How does Cole Nussbaumer Knaflic suggest choosing an effective visual?
- Visual Types: The book discusses various types of visuals like line graphs, bar charts, and scatterplots, and when to use each.
- Avoid Common Pitfalls: It advises against using pie charts, 3D effects, and secondary y-axes due to their potential to mislead.
- Consider Audience Needs: Choose visuals that are easy for your audience to understand and interpret.
- Practical Examples: The book provides examples of before-and-after visualizations to illustrate effective choices.
What is the importance of context in "Storytelling with Data"?
- Audience Understanding: Knowing who your audience is and what they need to know is crucial for effective communication.
- Purpose Clarity: Clearly define what you want your audience to do with the information you present.
- Data Relevance: Select data that supports your narrative and is relevant to your audience's needs.
- Consultation: The book suggests asking questions to stakeholders to fully understand the context before creating visuals.
How does "Storytelling with Data" address clutter in data visualization?
- Cognitive Load: Clutter increases cognitive load, making it harder for the audience to understand the data.
- Gestalt Principles: The book uses Gestalt principles to identify and eliminate unnecessary elements.
- Visual Order: It emphasizes the importance of alignment, white space, and contrast to create a clean visual.
- Step-by-Step Decluttering: Provides a process for systematically removing clutter from visuals.
How can preattentive attributes be used to focus attention according to "Storytelling with Data"?
- Definition: Preattentive attributes are visual properties that the brain processes quickly, such as color, size, and position.
- Attention Direction: Use these attributes to guide the audience's focus to the most important parts of the data.
- Visual Hierarchy: Create a hierarchy of information to lead the audience through the data in a logical order.
- Practical Application: The book provides examples of how to apply these attributes effectively in data visualization.
What does "Storytelling with Data" say about thinking like a designer?
- Form Follows Function: Design your visuals to serve the purpose of your communication effectively.
- Affordances: Use design elements that make it obvious how the audience should interact with the data.
- Aesthetics Matter: Aesthetic designs are perceived as easier to use and more engaging.
- Audience Acceptance: Strategies are provided for gaining acceptance of new or different visual designs.
How does "Storytelling with Data" suggest telling a story with data?
- Narrative Structure: Use a clear beginning, middle, and end to structure your data story.
- Conflict and Tension: Introduce conflict to engage your audience and drive the narrative.
- Repetition: Use repetition to reinforce key points and help them stick in the audience's memory.
- Practical Tactics: The book offers tactics like horizontal and vertical logic to ensure clarity in storytelling.
What are some of the best quotes from "Storytelling with Data" and what do they mean?
- "There is a story in your data." This emphasizes the book's core message that data should be transformed into a narrative to be impactful.
- "Clutter is your enemy." Highlights the importance of removing unnecessary elements to make data visualization clear and effective.
- "Think like a designer." Encourages readers to apply design principles to make data more accessible and engaging.
- "Tell a story." Reinforces the idea that storytelling is a powerful tool for making data memorable and actionable.
How does "Storytelling with Data" address the use of color in data visualization?
- Strategic Use: Color should be used sparingly and strategically to highlight important data points.
- Consistency: Maintain consistent use of color throughout a presentation to avoid confusing the audience.
- Colorblind Considerations: Design with colorblind audiences in mind, avoiding problematic color combinations like red and green.
- Tone and Emotion: Be mindful of the tone that colors convey and choose them to match the message.
What are some practical examples or case studies from "Storytelling with Data"?
- Dark Backgrounds: The book discusses how to adjust visuals for dark backgrounds to maintain readability and focus.
- Animation Use: It provides strategies for using animation in presentations to guide audience attention.
- Order Logic: Emphasizes the importance of logical order in data presentation to facilitate understanding.
- Spaghetti Graphs: Offers solutions for avoiding cluttered line graphs by emphasizing one line at a time or separating them spatially.
レビュー
本書『Storytelling with Data』は、明確で影響力のあるデータビジュアライゼーションを作成するための実践的なアドバイスが多くの読者から高く評価されている。読者はステップバイステップのガイダンス、ビフォーアフターの例、そしてストーリーテリングに焦点を当てた内容を特に評価している。初心者やビジネスプロフェッショナルにとって有用であると多くの人が感じている。一部の読者は、内容が基本的すぎる、または特定の分野で深みが欠けていると批判している。全体として、レビューアーはデータコミュニケーションスキルを向上させるための貴重なリソースとして本書を推奨しているが、既にこの分野で経験を積んでいる人にとってはあまり役立たないかもしれないと指摘する声もある。
Similar Books


