

Key Takeaways
You don't need to code or hold a PhD to interrogate data
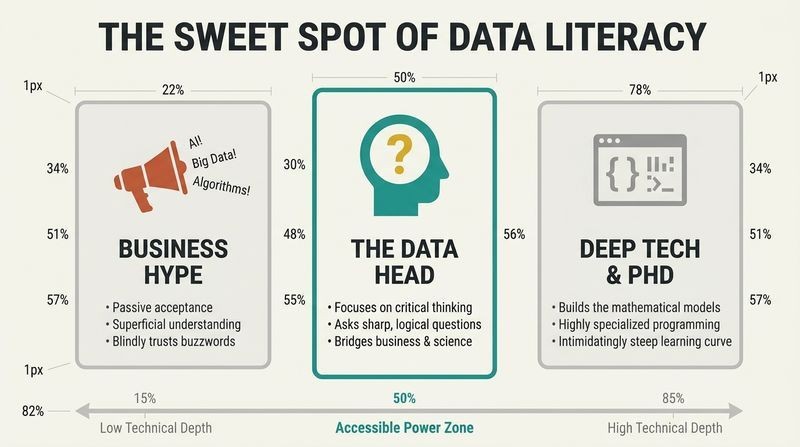
The book's thesis is that data literacy is a thinking skill, not a technical credential. The authors coin the term Data Head to describe anyone, marketer or CEO or engineer, who can think critically, speak intelligently, and ask sharp questions about statistics and machine learning without building the models themselves. They cite a 2019 Splunk survey: 98% of executives agreed data skills matter, yet 67% felt uncomfortable using data and 53% believed they were too old to learn. The authors call this data defeatism and reject it.
A Data Head sits in the middle ground between hype-peddling business books and intimidating 500-page technical tomes. The goal is to build a mental model, a storage room in your brain, so new concepts have somewhere to live.
What's refreshing here is the reframing of data literacy as civic competence rather than specialist turf. This echoes Thomas Davenport's notion of citizen data scientists and mirrors how spreadsheet fluency became a baseline office skill in the 1990s. The steelman: most costly data failures stem from bad questions and poor communication, not bad math, so empowering non-technical questioners has outsized leverage. A caveat worth noting: shallow literacy can breed overconfidence, the little-knowledge-is-dangerous problem, where a manager weaponizes half-understood statistics. The authors guard against this by emphasizing humility and question-asking over answer-giving, which is the right instinct.
Interrogate the business problem before anyone touches the data
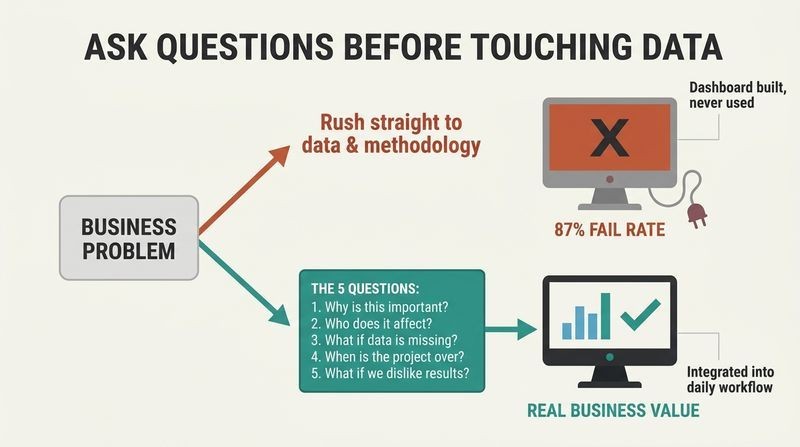
Before analysis begins, the authors insist on five questions: why is this problem important, who does it affect, what if we lack the right data, when is the project over, and what if we dislike the results. Skipping these is why data projects fail at alarming rates (they cite an estimate that 87% never reach production).
Their cautionary tale: a Fortune 10 company builds a sentiment-analysis dashboard tracking positive and negative tweets after a PR scandal. It goes live in the break room. Six months later it is quietly removed and nobody notices. The failure? Two warning signs appeared early. Methodology focus (someone wanted to use sentiment analysis because a competitor did) and deliverable focus (the goal became building a dashboard). Nobody asked whether monitoring sentiment would change a single person's daily work.
This is essentially product management wisdom imported into analytics: fall in love with the problem, not the solution. The methodology-focus trap resembles what economists call the streetlight effect, searching where the light is rather than where the keys are. The insight connects to Clayton Christensen's jobs-to-be-done framework, which asks what job a user hires a product to do. A useful extension: the authors' solution trial run (assume you have the answer, then ask who acts differently) is a lightweight pre-mortem. Organizations that institutionalize this single habit could plausibly recover a large share of the wasted analytics spend the book laments.
Everything varies, so stop chasing noise as if it were signal
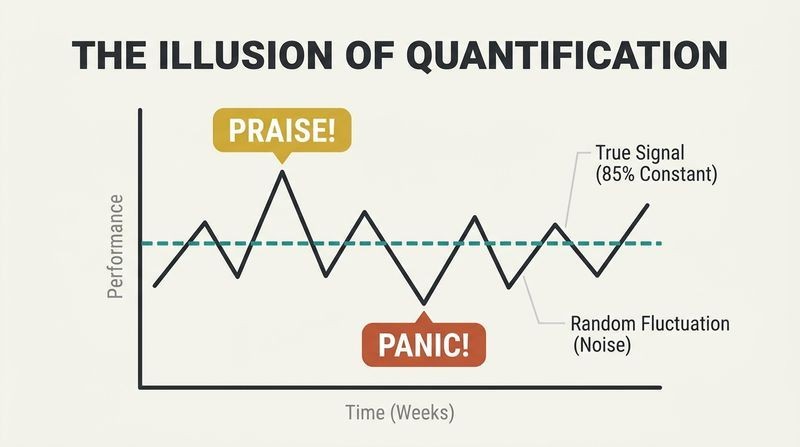
The core of statistical thinking is accepting that all measurements fluctuate. The authors distinguish measurement variation (from how you collect data) from random variation (inherent randomness in the process). Confuse the two and you'll waste energy reacting to noise.
Their simulation makes it vivid. A store chases an 85% customer-satisfaction target, and managers sweat over weekly dips and spikes. But the authors generated the data randomly with a true value of exactly 85%. Every peak and valley was pure chance, yet it triggered praise and panic. They call this the illusion of quantification. A second example: rural counties show both the highest and lowest kidney-cancer rates in America. Small populations produce extreme rates in both directions, a statistical artifact, not a health mystery.
This is the book's most transferable idea, and it echoes W. Edwards Deming's decades-old warning against tampering, adjusting a stable process in response to random fluctuation, which provably makes performance worse. The kidney-cancer example comes from Howard Wainer's work on the most dangerous equation (De Moivre's), where variance scales inversely with sample size. Managers everywhere reward and punish essentially random quarterly wobble. The deeper lesson borders on epistemic humility: control charts exist precisely to separate common-cause from special-cause variation. One nuance the reader should hold: accepting variation does not mean ignoring all change, the skill is distinguishing which is which.
Demand the data's origin story before trusting any result
Garbage in, garbage out. The authors urge readers to ask who collected the data, how, whether it is representative, and what is missing. The Challenger disaster anchors this. Engineers plotted the seven shuttle flights that had O-ring damage against temperature and saw no clear trend, so NASA launched in freezing weather. The fatal omission: the sixteen flights with zero incidents were left off the chart. Include them, and a statistical model predicts near-certain failure in the cold.
Key probes include:
1. Who collected it, and are they reliable?
2. Was it observational or experimental?
3. Is there sampling bias?
4. How were outliers and missing values handled?
5. Can it even measure what you claim?
Observational data should never, on its own, be used to claim causation.
The Challenger reframing is powerful because it recasts a famous engineering tragedy as a data-visualization failure, aligning with Edward Tufte's well-known analysis of the same event. The survivorship-bias structure (studying only flights that showed damage) is identical to Abraham Wald's WWII insight about armoring bombers where returning planes were not hit. What elevates this chapter is the point that missing data is often the most informative data. A modern parallel: machine-learning models trained on biased historical data inherit and amplify those gaps. The takeaway for practitioners is that data provenance auditing deserves as much rigor as model selection, yet it rarely gets it.
Your intuition about probability is reliably, spectacularly wrong
The authors run a classic trap. A virus infects 1% of company laptops. A test is 99% accurate both ways. Your laptop tests positive. What is the chance it is actually infected? Most people say 99%. The answer is 50%. Because so many more laptops are healthy, the false positives from the clean majority roughly equal the true positives from the tiny infected group.
This is the confusion of the inverse: mistaking the probability of a positive test given infection for the probability of infection given a positive test. They are linked by Bayes' Theorem, not equal. Other traps covered include the Gambler's fallacy (a slot machine is never due), wrongly assuming independence (the 2008 mortgage crisis treated linked defaults as independent), and the law of small numbers.
The base-rate neglect demonstrated here is one of the most consequential cognitive biases in medicine, law, and security screening. Kahneman and Tversky documented it, and Gerd Gigerenzer has shown that reframing probabilities as natural frequencies (1 in 100 rather than 1%) dramatically improves how doctors and jurors reason. The authors' 2008 example is chillingly apt: modeling correlated mortgage defaults as independent events understated tail risk catastrophically, a failure Nassim Taleb hammered. The practical upshot: whenever you see a screening test result, ask for the base rate first. Without it, even a 99% accurate test can be a coin flip.
A statistically significant result can be practically meaningless
The authors demystify hypothesis testing. You assume a null hypothesis (the status quo, like an intern shoots 50%), then look for enough evidence to reject it. A p-value is the probability of seeing your data if the null were true. The significance level (often an arbitrary 0.05) is the threshold. Reject the null when the p-value falls below it.
But significance is not importance. With large samples, trivially small effects turn significant. Their example: US and European basketball players differ in height by half an inch with a tiny confidence interval. Statistically significant, practically pointless. They urge nine questions, including what is the sample size, how many tests are you running (run enough and false positives appear by chance), and can I see the confidence intervals rather than just p-values.
This chapter arrives amid a genuine reproducibility crisis in science, where over-reliance on p-below-0.05 has fueled p-hacking and a wave of retracted findings. The American Statistical Association issued a rare formal statement in 2016 warning against exactly this misuse. The authors' insistence on confidence intervals over bare p-values aligns with the growing new-statistics movement led by Geoff Cumming. One subtle point worth amplifying: the null-hypothesis framework itself embeds a philosophical choice, treating the status quo as innocent until proven guilty. That asymmetry is defensible for drug trials but arbitrary elsewhere. The practical-significance filter is the reader's best defense against being dazzled by a small p.
Unsupervised learning needs far more supervision than its name admits
When data has no predefined labels, unsupervised learning hunts for hidden structure. The authors cover two workhorses. Principal component analysis (PCA) condenses many correlated columns into fewer uncorrelated composite dimensions while keeping most of the information, like sorting 30 fitness metrics into strength, speed, stamina, and health. Clustering (via k-means) groups similar rows, like sorting 200 stores into six regions.
The catch, illustrated by organizing a stack of unlabeled vinyl records, is that the human makes endless subjective choices: how many clusters, how to scale variables, which distance measure defines closeness, how many components to keep. There is no single right answer. The authors warn against over-naming principal components with catchy labels that imply structure the data does not contain.
The record-sorting metaphor nicely captures why unsupervised results resist validation, there is no ground truth to check against. This connects to a persistent tension in exploratory statistics: the same dataset can yield wildly different clusterings depending on preprocessing, a fragility documented across bioinformatics. The warning about scaling is underappreciated: an income column measured in dollars will swamp an age column simply because its numbers are larger, silently dictating the clusters. A worthwhile extension is that PCA assumes variance equals importance, which can mislead, a highly variable but irrelevant feature (say, a random ID) can hijack a component. Treat these methods as hypothesis generators, not answer machines.
Linear regression is a power tool that maims the careless
Regression predicts a number by fitting the line that minimizes squared errors between predictions and actual values, and it reports an R-squared showing how much variation it explains. Beyond prediction, its coefficients explain relationships: holding all else constant, one input's effect on the output. But the authors catalog its many failure modes.
Watch for:
1. Omitted variables (shoe size predicts reading ability only because age is missing)
2. Multicollinearity (correlated inputs scramble coefficient interpretation)
3. Data leakage (an input secretly containing the answer, like using the initial offer to predict a home's final sale price)
4. Extrapolation (a lemonade model predicting negative sales at 0 degrees)
5. Overfitting (memorizing the training data's noise instead of learning the pattern)
The fix for overfitting: split data into a training set and a test set.
The explain-versus-predict distinction the authors draw is a genuinely deep one, formalized in Galit Shmueli's influential paper. A model optimized for accurate prediction can violate the assumptions needed for clean causal interpretation, and vice versa, yet practitioners routinely conflate the two goals. Data leakage deserves special emphasis because it is seductive, it produces gorgeous validation scores that evaporate in production, and textbooks rarely cover it since their datasets are pristine. The extrapolation warning connects to the 2008 crisis again: models trained on rising-market data had no vocabulary for a crash. The enduring lesson is that a model is a compression of the past, mute about conditions it never saw.
Accuracy is a liar when your classes are imbalanced
Classification predicts labels, not numbers, using tools like logistic regression (which outputs a probability, then needs a human-chosen cutoff to become a yes or no), decision trees, and ensemble methods like random forests and gradient boosted trees. The trap is judging these models by raw accuracy.
If 99.5% of people never click an ad, a model that predicts nobody ever clicks is 99.5% accurate and utterly useless. The authors insist on establishing a control (the majority-class rate) and reading a confusion matrix, which breaks results into true positives, true negatives, false positives, and false negatives. From it you derive the true positive rate (sensitivity or recall) and true negative rate (specificity). Raising the decision cutoff trades one against the other, a business judgment, not a software default.
The imbalanced-data problem is the quiet killer of real-world machine learning, from fraud detection to disease screening, where the interesting cases are rare by definition. The authors' insistence on a majority-class baseline is the single most useful discipline a manager can enforce, and it is astonishing how often it is skipped. The confusion-matrix vocabulary also exposes an ethical dimension: choosing a cutoff means choosing whose errors matter more, a false positive that jails an innocent person versus a false negative that frees a guilty one. That framing links the technical to the moral, and it makes clear why the cutoff is a leadership decision that should never be delegated to a library's default of 0.5.
To a computer, all text is numbers stripped of meaning
Text analytics converts messy language into structured numbers, and the conversion is where meaning leaks out. The simplest method, bag-of-words, jumbles a sentence into word counts, discarding order entirely. So Jordan loves hotdogs but hates hamburgers becomes identical in structure to its opposite. N-grams (sequences of consecutive words) restore some context. Word embeddings (like Google's Word2vec) represent each word as a vector of numbers capturing meaning, so beef and pork land near each other.
The sobering reality: big tech dominates because sentiment analysis and translation demand mountains of labeled data, supercomputers, and research teams most companies lack. Word clouds, the usual first experiment, teach almost nothing. Set expectations low before analyzing your own text.
The core insight, that converting text to numbers destroys nuance, remains true even in the transformer era that postdates this book, though embeddings have grown vastly more powerful. The have-versus-have-nots framing is prescient: the moat around language AI is data and compute, not algorithms, which are largely open-source. This mirrors broader debates about AI centralization. One useful nuance the authors surface is domain specificity, a sentiment model trained on movie reviews misreads a grocery chain's comments because vocabulary and connotation shift by context. The practical guidance to manage expectations before starting is unglamorous but saves organizations from the predictable disillusionment cycle of adopting, over-hyping, then abandoning text analytics.
Neural networks are giant math equations, not digital brains
Deep learning uses artificial neural networks with two or more hidden layers. The authors demystify the brain analogy: a neuron is just an activation function combining inputs, and the network as a whole is nested equations, essentially stacked logistic regressions, that learn optimal weights through a process called backpropagation. The brain comparison, they argue, projects false intelligence onto what is fundamentally arithmetic.
Deep learning's recent triumphs came not from new brain-like insight but from three converging forces: massive labeled datasets from the internet, faster GPU hardware (a hundredfold speedup in training), and algorithmic improvements. It excels at perceptual problems like image recognition and speech, but on ordinary structured spreadsheet data it often loses to simpler tree-based methods. And it demands enormous labeled data most firms do not have.
Puncturing the brain metaphor is a genuine public service, because that metaphor drives both irrational fear (runaway superintelligence) and irrational hope (imminent human-level cognition). The authors correctly locate deep learning's leap in data plus compute rather than conceptual breakthrough, a point Rich Sutton later crystallized as the bitter lesson. Their observation that trees often beat neural nets on tabular data has since been confirmed by rigorous benchmarks and remains counterintuitive to hype-driven teams. The ethics section deserves amplification: deepfakes and recidivism-prediction tools raise the stakes of black-box opacity. The reframing that we are often modeling people, not just data points, is the moral spine of the whole book.
Most data projects die from bad communication, not bad math
The authors argue the biggest impediment to data science success is the communication gap between analysts and decision-makers. They sketch seven failure scenes, including The Postmortem (an expert dragged in too late to save a doomed project), The Telephone Game (a preliminary stat from casual coffee chat, 75% based on just 8 people, gets repeated as company gospel), and Into the Weeds (a technically correct analysis so jargon-laden nobody can act on it).
They classify three personalities: Data Enthusiasts (love the hype, skip the hard questions), Data Cynics (trust their gut over any analysis), and Data Heads (skeptics whose doubt is informed by knowledge and delivered with empathy). Bridging the gap requires meeting people where they are, listening, and respecting domain expertise, not just technical firepower.
This closing move, locating failure in human dynamics rather than technique, distinguishes the book from purely technical texts and aligns with organizational research showing that analytics ROI depends more on culture than on tooling. The Telephone Game scene is a precise diagnosis of how unvetted numbers acquire false authority through repetition, an information-cascade problem studied in behavioral economics. The three-personality taxonomy is a useful conversational tool, though real people flicker between all three depending on whether the data flatters their priors. The deepest point is that empathy is a data skill. Translation between technical and business worlds is itself expertise, undervalued precisely because it leaves no code behind.
Analysis
Becoming a Data Head is a business-literacy book disguised as a technical primer, and its structure (think, speak, understand, ensure success) deliberately front-loads judgment over computation. Its central and somewhat contrarian bet is that the binding constraint on organizational data value is not algorithmic horsepower but critical thinking and communication. That bet is well-supported. The recurring villains, assuming independence in the 2008 mortgage collapse, omitting the safe flights before Challenger, chasing random variation in customer surveys, are all failures of reasoning and framing, not arithmetic.
The book's intellectual through-line is variation and uncertainty. Nearly every chapter is a variation on one theme: reality is noisier than our narratives, and the disciplined response is calibrated humility rather than false certainty or reflexive cynicism. This places the work in a lineage running from Deming's statistical process control through Kahneman and Tversky's heuristics-and-biases program to the modern reproducibility crisis. What the authors add is a practitioner's translation layer, a set of concrete questions a non-specialist can deploy in a meeting to pressure-test claims. The book's principal limitation is one of shelf life and depth. Written in 2021, its treatment of deep learning and text analytics predates the large-language-model era, though its foundational skepticism ages better than its specifics. And by design it sacrifices rigor for accessibility, a reader cannot build a model from it. But that is the point. Its highest-value contributions are transferable mental models that resist obsolescence: base rates, confounding, overfitting, imbalanced-class accuracy, statistical versus practical significance, and provenance auditing. The most original and durable move is ethical and organizational, insisting that data literacy is a civic and communicative skill, that behind the rows and columns are people, and that the person who can bridge the technical and business worlds with empathy is the scarce and valuable one. It reframes fluency as responsibility.
Review Summary
Becoming a Data Head is highly praised for its accessible introduction to data science concepts. Readers appreciate its clear explanations of complex topics, making it valuable for both beginners and experienced professionals. The book covers a wide range of subjects, from basic statistics to machine learning and AI. Many reviewers found it helpful for understanding data-driven decision-making in business contexts. While some felt it was too basic, most agreed it provides a solid foundation for anyone looking to enhance their data literacy.
People Also Read







FAQ
1. What is Becoming a Data Head by Alex J. Gutman about?
- Comprehensive data literacy guide: The book aims to make data science, statistics, and machine learning accessible to non-experts, bridging the gap between technical and business professionals.
- Critical thinking focus: It teaches readers to ask the right questions, understand data nuances, and recognize common pitfalls in data projects.
- Practical, real-world approach: Everyday examples, analogies, and clear explanations help demystify complex topics for a broad audience.
- Human side of data: The book also addresses communication challenges and team dynamics in data-driven organizations.
2. Why should I read Becoming a Data Head by Alex J. Gutman?
- Demystifies data science buzzwords: The book breaks down intimidating concepts like AI, machine learning, and big data into understandable language.
- Bridges communication gaps: It equips non-technical readers to engage meaningfully with data professionals, improving collaboration and decision-making.
- Prepares for a data-driven future: Readers gain the skills to think critically about data and become effective “Data Heads” in their organizations.
- Real-world relevance: The book highlights common pitfalls and challenges, making it valuable for business leaders and professionals navigating data projects.
3. What are the key takeaways from Becoming a Data Head by Alex J. Gutman?
- Ask fundamental questions: Always clarify why a problem matters, who it affects, and whether the right data exists before starting a project.
- Think statistically: Understand variation, probability, and the difference between data and information to interpret results critically.
- Challenge assumptions: Learn to question data sources, representativeness, statistical significance, and causality to avoid common analytical errors.
- Continuous learning: The book encourages ongoing critical thinking and building a shared language between data workers and decision makers.
4. How does Becoming a Data Head by Alex J. Gutman define data and its types?
- Data vs. information: Data is encoded information, typically structured in datasets with rows (observations) and columns (features or variables).
- Types of data: Numeric data can be continuous (like temperature) or count-based, while categorical data can be ordered (ordinal) or unordered (nominal).
- Observational vs. experimental: Observational data is passively collected, while experimental data is gathered under controlled conditions to infer causality.
- Importance of structure: Understanding data types is crucial for selecting appropriate analysis methods.
5. What is statistical thinking according to Becoming a Data Head by Alex J. Gutman?
- Embrace variation and uncertainty: All data contains variation; questioning and understanding this is essential.
- Probability and statistics tools: Use these to manage uncertainty, understand sampling variation, and avoid misconceptions like the law of small numbers.
- Critical, not cynical: The goal is to appreciate data’s limitations and use it wisely, not to reject it outright.
- Ask probing questions: Always inquire about data sources, collection methods, and potential biases.
6. What are the main questions to ask when arguing with data in Becoming a Data Head by Alex J. Gutman?
- Data origin story: Who collected the data, how was it collected, and is it observational or experimental?
- Representativeness and bias: Is the data representative of the population, and are there sampling biases or outliers?
- Missing data and measurement: What data is missing, how was it handled, and does the data truly measure the intended concept?
- Context matters: Always consider the context and limitations of the data before drawing conclusions.
7. How does Becoming a Data Head by Alex J. Gutman explain probability and its common pitfalls?
- Probability basics: Probability quantifies uncertainty, ranging from 0 to 1, with conditional probabilities depending on other events.
- Common traps: Avoid assuming independence incorrectly, falling for the gambler’s fallacy, and confusing conditional probabilities.
- Bayes’ theorem: The book introduces Bayes’ theorem as a key tool for relating conditional probabilities, using practical examples like virus testing.
- Critical interpretation: Understanding probability helps avoid misinterpretation and supports better decision-making.
8. What guidance does Becoming a Data Head by Alex J. Gutman provide on challenging statistics and hypothesis testing?
- Understand context and sample size: Always ask what the statistics mean, the size of the sample, and what question is being tested.
- Hypothesis testing basics: Learn about null and alternative hypotheses, significance levels, p-values, and confidence intervals.
- Beware of causality assumptions: Correlation does not imply causation; experimental design is needed to infer causal relationships.
- Skeptical mindset: Maintain skepticism and seek transparency in statistical claims.
9. What are the key concepts of unsupervised learning explained in Becoming a Data Head by Alex J. Gutman?
- Dimensionality reduction with PCA: Principal component analysis reduces many correlated features into fewer uncorrelated components, simplifying data analysis.
- Clustering techniques: Methods like k-means and hierarchical clustering group similar observations without predefined labels, revealing natural groupings.
- Practical cautions: Unsupervised learning requires careful supervision in choosing the number of components or clusters and interpreting results.
- Data preparation: Proper scaling and understanding of the data are essential to avoid misleading conclusions.
10. How does Becoming a Data Head by Alex J. Gutman explain supervised learning, regression, and classification models?
- Supervised learning paradigm: Models are trained on input-output pairs to predict outcomes for new data, with regression for continuous values and classification for categories.
- Linear and logistic regression: Linear regression predicts continuous outcomes, while logistic regression handles binary classification, outputting probabilities.
- Decision trees and ensembles: Decision trees split data into rules, while ensemble methods like random forests and gradient boosting improve accuracy but reduce interpretability.
- Common pitfalls: The book warns about data leakage, overfitting, not splitting data into training and test sets, and misunderstanding accuracy metrics.
11. How does Becoming a Data Head by Alex J. Gutman approach text analytics, deep learning, and unstructured data?
- Text data challenges: Computers require text to be converted into numbers using methods like bag-of-words, n-grams, and word embeddings.
- Text analysis methods: Topic modeling and text classification (e.g., Naïve Bayes) are covered, with emphasis on context and domain adaptation.
- Deep learning basics: Neural networks with hidden layers learn complex patterns, automating feature engineering for tasks like image and language processing.
- Limitations and requirements: Deep learning needs large labeled datasets, significant computing power, and careful attention to ethical issues like algorithmic bias.
12. What common pitfalls, biases, and communication challenges in data projects does Becoming a Data Head by Alex J. Gutman warn about?
- Statistical and project biases: The book explains survivorship bias, regression to the mean, Simpson’s paradox, confirmation bias, and algorithmic bias, showing how they can mislead analysis.
- Project management pitfalls: Misapplied problems, data leakage, overfitting, non-representative samples, and unrealistic expectations are highlighted as common causes of failure.
- Communication breakdowns: Scenarios like The Postmortem, The Telephone Game, and The Blowhard illustrate how miscommunication derails projects.
- Data personalities: Understanding and engaging with Data Enthusiasts, Cynics, and Heads is crucial for successful collaboration and project outcomes.
Download PDF
Download EPUB
.epub digital book format is ideal for reading ebooks on phones, tablets, and e-readers.