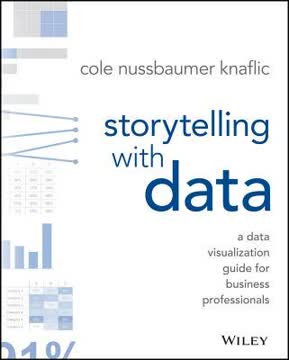
가지 주요 요점
1. 데이터 시각화 전에 청중과 맥락을 이해하라
데이터에는 이야기가 담겨 있습니다. 하지만 도구는 그 이야기가 무엇인지 알지 못합니다. 그 이야기를 시각적이고 맥락적으로 생동감 있게 전달하는 것은 분석가나 정보 전달자의 역할입니다.
청중을 파악하라. 데이터 시각화에 뛰어들기 전에 청중이 누구인지, 그들이 무엇을 알고 싶어 하는지 명확히 파악하십시오. 이 이해는 메시지를 구성하는 모든 결정에 영향을 미칩니다. 고려할 사항:
- 특정 청중은 누구인가? (예: 의사 결정자, 팀원, 고객)
- 그들이 주제에 대해 얼마나 알고 있는가?
- 데이터를 본 후 그들이 어떤 행동을 취하기를 원하는가?
목적을 명확히 하라. 전달하고자 하는 핵심 메시지와 데이터가 이를 어떻게 뒷받침하는지 결정하십시오. 다음과 같은 도구를 사용하십시오:
- "큰 아이디어": 주요 요점을 간결하게 요약한 한 문장
- "3분 이야기": 메시지의 본질을 포착한 간략한 개요
- 스토리보드: 콘텐츠의 구조를 설정하기 위한 시각적 개요
초기에 맥락을 이해하는 데 시간을 투자하면 청중에게 공감하고 행동을 유도하는 더 집중적이고 영향력 있는 데이터 시각화를 만들 수 있습니다.
2. 데이터와 메시지에 맞는 시각적 디스플레이 선택
답은 항상 동일합니다: 청중이 가장 쉽게 읽을 수 있는 것을 선택하십시오.
형태를 기능에 맞추라. 데이터 유형과 전달하고자 하는 이야기가 시각적 디스플레이 선택을 안내해야 합니다. 다음과 같은 일반적인 옵션을 고려하십시오:
- 표: 정확한 조회 값이나 혼합 단위 측정에 적합
- 선 그래프: 시간 경과에 따른 추세를 보여주는 데 이상적
- 막대 차트: 카테고리 비교에 탁월
- 산점도: 변수 간의 관계를 보여주는 데 유용
불필요한 복잡성을 피하라. 더 간단한 차트가 종종 더 효과적입니다:
- 파이 차트 사용을 제한하십시오. 해석하기 어려울 수 있습니다.
- 3D 효과를 피하십시오. 데이터 인식을 왜곡할 수 있습니다.
- 이중 축 차트는 혼란을 줄 수 있으므로 주의하십시오.
시각적 선택이 청중이 주요 정보를 빠르게 파악할 수 있도록 해야 합니다. 확신이 서지 않으면 동료들과 다양한 옵션을 테스트하여 가장 명확하게 전달되는 것을 확인하십시오.
3. 명확성과 집중을 높이기 위해 군더더기를 제거하라
불필요한 요소는 시각적 자료를 불필요하게 복잡하게 만듭니다.
무자비하게 단순화하라. 시각화의 모든 요소는 목적을 가져야 합니다. 이해에 직접적으로 기여하지 않는 것은 식별하고 제거하십시오:
- 격자선 (또는 매우 가볍게 만들기)
- 중복 레이블
- 과도한 소수점 자리
- 장식적인 그래픽이나 테두리
여백을 전략적으로 사용하라. 캔버스의 모든 인치를 채울 필요는 없습니다. 여백은:
- 중요한 요소에 주의를 집중시키는 데 도움
- 시각화를 덜 압도적으로 만듦
- 전체적인 가독성을 향상시킴
강조를 통해 강조하라. 중요한 요소를 돋보이게 하는 대신, 다른 모든 것을 약화시키십시오. 이는 청중의 주의를 유도하는 더 미묘하고 효과적인 방법이 될 수 있습니다.
군더더기를 제거함으로써 청중의 인지 부담을 줄이고, 그들이 데이터 시각화에서 주요 통찰을 더 빠르고 쉽게 파악할 수 있도록 합니다.
4. 주의 집중을 효과적으로 유도하기 위해 사전 주의 속성을 사용하라
사전 주의 속성을 전략적으로 사용하면 청중이 우리가 원하는 것을 보게 할 수 있습니다.
시각적 단서를 활용하라. 사전 주의 속성은 우리의 뇌가 거의 즉각적으로 처리하는 시각적 속성입니다. 이를 사용하여 중요한 정보를 강조하십시오:
- 색상: 중요한 데이터 포인트를 강조하기 위해 절제하여 사용
- 크기: 중요한 요소를 더 크게 만듦
- 위치: 눈이 자연스럽게 먼저 가는 곳에 중요한 정보를 배치 (종종 좌측 상단)
- 형태: 카테고리를 구별하기 위해 독특한 형태 사용
시각적 계층 구조를 만들라. 사전 주의 속성을 결합하여 청중이 특정 순서로 정보를 탐색하도록 유도하십시오:
- 주요 초점: 가장 강력한 시각적 단서 사용
- 부차적 정보: 더 미묘한 차별화 적용
- 맥락: 지원 세부 사항을 눈에 띄지 않게 유지
색상을 의도적으로 사용하라. 색상은 강력한 도구이지만, 과도한 사용은 그 효과를 감소시킵니다:
- 강조를 위해 단일 강조 색상 선택
- 시각화 전반에 걸쳐 일관되게 색상 사용
- 색맹 친화적인 팔레트를 고려
사전 주의 속성을 전략적으로 적용함으로써 청중의 주의를 유도하고 데이터 이야기를 통해 명확한 시각적 경로를 만들 수 있습니다.
5. 접근 가능하고 미적인 시각화를 위한 디자인 원칙 적용
형태는 기능을 따른다.
접근성을 우선시하라. 시각화가 넓은 청중에게 쉽게 이해될 수 있도록 하십시오:
- 명확하고 읽기 쉬운 글꼴 사용
- 텍스트와 배경 사이에 충분한 대비 제공
- 설명적인 제목과 레이블 포함
- 색상만으로 정보를 전달하지 않도록 주의
시각적 매력을 창출하라. 미적으로 만족스러운 디자인은 사용하기 쉽고 더 신뢰할 수 있는 것으로 인식됩니다:
- 요소를 정렬하여 질서감을 창출
- 일관된 스타일링 (글꼴, 색상, 간격) 사용
- 여백과 콘텐츠의 균형 유지
매체를 고려하라. 다양한 형식에 맞게 디자인을 조정하십시오:
- 프레젠테이션: 텍스트가 적은 더 간단한 시각화
- 보고서: 설명을 지원하는 더 자세한 시각화
- 대화형 대시보드: 탐색을 허용하면서 주요 통찰을 유도
좋은 디자인은 시청자에게 자연스럽게 느껴져야 합니다. 청중이 콘텐츠보다 디자인 자체에 집중하고 있다면, 더 단순화해야 할 필요가 있을 수 있습니다.
6. 데이터를 생동감 있게 만드는 설득력 있는 내러티브 작성
이야기는 데이터만으로는 전달할 수 없는 방식으로 우리에게 공감하고 기억에 남습니다.
이야기의 구조를 잡아라. 청중을 참여시키기 위해 고전적인 스토리텔링 요소를 사용하십시오:
- 시작: 맥락을 설정하고 문제를 소개
- 중간: 데이터와 분석을 제시
- 끝: 통찰과 행동 촉구로 결론
긴장감을 조성하라. 현재 상황과 원하는 결과 사이의 격차를 강조하여 관심을 유지하십시오:
- 데이터가 다루는 문제는 무엇인가?
- 청중이 왜 관심을 가져야 하는가?
- 무엇을 개선하거나 변경할 수 있는가?
내러티브 기법 사용:
- 반복: 주요 요점을 강화
- 비유: 복잡한 개념을 이해하기 쉽게 만듦
- 구체적인 예: 실제 응용으로 데이터를 생동감 있게 만듦
데이터는 이야기를 지원해야 하며, 이야기가 되어서는 안 됩니다. "그래서 뭐?"에 집중하십시오 – 정보가 왜 중요한지, 어떤 행동을 유도해야 하는지.
7. 데이터 이야기를 다듬기 위해 반복하고 피드백을 구하라
데이터와 소통하는 데 있어 새로운 관점을 얻는 것은 엄청난 가치를 지닙니다.
반복을 받아들여라. 첫 시도는 거의 최선이 아닙니다. 여러 번의 수정 시간을 계획하십시오:
- 다양한 접근 방식을 탐색하기 위해 빠른 초안을 작성
- 잠시 떨어져 있다가 새로운 시각으로 돌아오기
- 새로운 아이디어가 더 효과적이라면 처음부터 다시 시작할 의지
다양한 피드백을 구하라. 다양한 관점은 맹점을 발견하고 명확성을 향상시킬 수 있습니다:
- 주제에 익숙한 동료
- 일반 이해를 테스트하기 위한 분야 외부 사람들
- 가능하다면 목표 청중의 구성원
이해도를 테스트하라. 리뷰어에게 구체적인 질문을 하십시오:
- 주요 메시지가 무엇이라고 생각하는가?
- 이것을 본 후 어떤 질문이 있는가?
- 이 정보를 바탕으로 무엇을 다르게 할 것인가?
피드백에서 얻은 통찰을 사용하여 시각화와 내러티브를 다듬으십시오. 목표는 효과적인 소통이지 완벽함이 아닙니다. 반복을 통한 지속적인 개선은 더 강력한 데이터 스토리텔링 기술을 개발하는 데 도움이 될 것입니다.
마지막 업데이트 날짜:
FAQ
What's "Storytelling with Data" about?
- Purpose: "Storytelling with Data" by Cole Nussbaumer Knaflic is a guide for business professionals on how to effectively communicate data through visualization.
- Focus: The book emphasizes the importance of storytelling in data presentation, aiming to transform raw data into compelling narratives.
- Audience: It is written for anyone who needs to communicate data-driven insights, including analysts, managers, and leaders.
- Structure: The book is organized into lessons that cover understanding context, choosing visuals, eliminating clutter, focusing attention, thinking like a designer, and telling a story.
Why should I read "Storytelling with Data"?
- Improve Communication: It provides practical strategies to enhance your ability to communicate complex data clearly and effectively.
- Professional Edge: Mastering data storytelling can set you apart in the workplace, as it is a skill increasingly in demand.
- Broad Applicability: The lessons are applicable across various industries and roles, making it a versatile resource.
- Engaging Content: The book is filled with real-world examples and case studies that make the concepts relatable and easy to understand.
What are the key takeaways of "Storytelling with Data"?
- Understand Context: Before visualizing data, know your audience and what you want them to learn or do.
- Choose Effective Visuals: Select the right type of graph or chart to best convey your message.
- Eliminate Clutter: Remove unnecessary elements that do not add value to your data visualization.
- Tell a Story: Use narrative techniques to make your data more engaging and memorable.
How does Cole Nussbaumer Knaflic suggest choosing an effective visual?
- Visual Types: The book discusses various types of visuals like line graphs, bar charts, and scatterplots, and when to use each.
- Avoid Common Pitfalls: It advises against using pie charts, 3D effects, and secondary y-axes due to their potential to mislead.
- Consider Audience Needs: Choose visuals that are easy for your audience to understand and interpret.
- Practical Examples: The book provides examples of before-and-after visualizations to illustrate effective choices.
What is the importance of context in "Storytelling with Data"?
- Audience Understanding: Knowing who your audience is and what they need to know is crucial for effective communication.
- Purpose Clarity: Clearly define what you want your audience to do with the information you present.
- Data Relevance: Select data that supports your narrative and is relevant to your audience's needs.
- Consultation: The book suggests asking questions to stakeholders to fully understand the context before creating visuals.
How does "Storytelling with Data" address clutter in data visualization?
- Cognitive Load: Clutter increases cognitive load, making it harder for the audience to understand the data.
- Gestalt Principles: The book uses Gestalt principles to identify and eliminate unnecessary elements.
- Visual Order: It emphasizes the importance of alignment, white space, and contrast to create a clean visual.
- Step-by-Step Decluttering: Provides a process for systematically removing clutter from visuals.
How can preattentive attributes be used to focus attention according to "Storytelling with Data"?
- Definition: Preattentive attributes are visual properties that the brain processes quickly, such as color, size, and position.
- Attention Direction: Use these attributes to guide the audience's focus to the most important parts of the data.
- Visual Hierarchy: Create a hierarchy of information to lead the audience through the data in a logical order.
- Practical Application: The book provides examples of how to apply these attributes effectively in data visualization.
What does "Storytelling with Data" say about thinking like a designer?
- Form Follows Function: Design your visuals to serve the purpose of your communication effectively.
- Affordances: Use design elements that make it obvious how the audience should interact with the data.
- Aesthetics Matter: Aesthetic designs are perceived as easier to use and more engaging.
- Audience Acceptance: Strategies are provided for gaining acceptance of new or different visual designs.
How does "Storytelling with Data" suggest telling a story with data?
- Narrative Structure: Use a clear beginning, middle, and end to structure your data story.
- Conflict and Tension: Introduce conflict to engage your audience and drive the narrative.
- Repetition: Use repetition to reinforce key points and help them stick in the audience's memory.
- Practical Tactics: The book offers tactics like horizontal and vertical logic to ensure clarity in storytelling.
What are some of the best quotes from "Storytelling with Data" and what do they mean?
- "There is a story in your data." This emphasizes the book's core message that data should be transformed into a narrative to be impactful.
- "Clutter is your enemy." Highlights the importance of removing unnecessary elements to make data visualization clear and effective.
- "Think like a designer." Encourages readers to apply design principles to make data more accessible and engaging.
- "Tell a story." Reinforces the idea that storytelling is a powerful tool for making data memorable and actionable.
How does "Storytelling with Data" address the use of color in data visualization?
- Strategic Use: Color should be used sparingly and strategically to highlight important data points.
- Consistency: Maintain consistent use of color throughout a presentation to avoid confusing the audience.
- Colorblind Considerations: Design with colorblind audiences in mind, avoiding problematic color combinations like red and green.
- Tone and Emotion: Be mindful of the tone that colors convey and choose them to match the message.
What are some practical examples or case studies from "Storytelling with Data"?
- Dark Backgrounds: The book discusses how to adjust visuals for dark backgrounds to maintain readability and focus.
- Animation Use: It provides strategies for using animation in presentations to guide audience attention.
- Order Logic: Emphasizes the importance of logical order in data presentation to facilitate understanding.
- Spaghetti Graphs: Offers solutions for avoiding cluttered line graphs by emphasizing one line at a time or separating them spatially.
리뷰
Storytelling with Data는 명확하고 효과적인 데이터 시각화를 만드는 실용적인 조언으로 주로 긍정적인 평가를 받고 있다. 독자들은 단계별 안내, 전후 비교 예시, 그리고 스토리텔링에 중점을 둔 점을 높이 평가한다. 많은 이들이 초보자와 비즈니스 전문가들에게 유용하다고 생각한다. 일부는 내용이 너무 기본적이거나 특정 영역에서 깊이가 부족하다고 비판하기도 한다. 전반적으로, 리뷰어들은 데이터 커뮤니케이션 기술을 향상시키는 데 유용한 자원으로 추천하지만, 이미 해당 분야에 경험이 있는 사람들에게는 덜 도움이 될 수 있다고 언급한다.
Similar Books


