重点摘要
1. 在可视化数据之前了解你的受众和背景
你的数据中有一个故事。但你的工具不知道那个故事是什么。这就需要你——信息的分析者或传播者——将那个故事在视觉和背景上呈现出来。
了解你的受众。 在深入数据可视化之前,明确识别你的受众是谁以及他们需要知道或做什么。这种理解将影响你在构建信息时做出的每一个决定。考虑以下问题:
- 你的具体受众是谁?(例如,决策者、团队成员、客户)
- 他们对该主题的熟悉程度如何?
- 你希望他们在看到你的数据后采取什么行动?
明确你的目的。 确定你想传达的关键信息以及你的数据如何支持它。使用以下工具:
- “大意”:一句话概括你的主要观点
- “三分钟故事”:简要概述你的信息精髓
- 故事板:内容的视觉大纲以建立结构
通过在前期投入时间了解背景,你将创建更有针对性、更有影响力的数据可视化,使其与受众产生共鸣并推动行动。
2. 为你的数据和信息选择合适的视觉展示
答案总是一样的:无论什么对你的受众来说最容易阅读。
匹配形式与功能。 你拥有的数据类型和你想讲述的故事应该指导你选择的视觉展示形式。考虑以下常见选项:
- 表格:最适合精确查找值或混合单位的测量
- 折线图:理想用于显示随时间变化的趋势
- 条形图:非常适合比较类别
- 散点图:用于显示变量之间的关系
避免不必要的复杂性。 简单的图表通常更有效:
- 限制使用饼图,因为它们可能难以准确解释
- 避免3D效果,因为它们可能扭曲数据感知
- 谨慎使用双轴图表,因为它们可能令人困惑
记住,你选择的视觉形式应该使你的受众更容易快速掌握关键信息。如果不确定,可以与同事测试不同选项,看看哪一个传达得最清楚。
3. 消除杂乱以增强清晰度和焦点
因为它使我们的视觉效果看起来比实际更复杂。
无情地简化。 你可视化中的每个元素都应该有其目的。识别并移除任何不直接有助于理解的内容:
- 网格线(或使其非常轻)
- 冗余标签
- 过多的小数位
- 装饰性图形或边框
战略性地使用空白。 不要觉得必须填满画布的每一寸。空白:
- 有助于将注意力引导到重要元素上
- 使你的可视化感觉不那么压迫
- 提高整体可读性
通过弱化来强调。 与其让重要元素突出,不如尝试弱化其他所有内容。这可能是一种更微妙且有效的方式来引导受众的注意力。
通过减少杂乱,你降低了受众的认知负担,使他们能够更快、更容易地掌握数据可视化中的关键见解。
4. 使用前注意属性有效引导注意力
如果我们战略性地使用前注意属性,它们可以帮助我们让受众在他们意识到之前看到我们想让他们看到的东西!
利用视觉提示。 前注意属性是我们大脑几乎瞬间处理的视觉特性,在有意识注意之前。使用它们来突出关键信息:
- 颜色:谨慎使用以吸引注意力到重要数据点
- 大小:使关键元素更大
- 位置:将重要信息放在眼睛自然首先看的地方(通常是左上角)
- 形状:使用不同的形状区分类别
创建视觉层次。 结合前注意属性,引导你的受众按特定顺序浏览信息:
- 主要焦点:使用最强的视觉提示
- 次要信息:应用更微妙的区分
- 背景:保持支持性细节可见但弱化
有意使用颜色。 颜色是一个强大的工具,但过度使用会削弱其影响:
- 选择单一强调色以突出重点
- 在整个可视化中一致使用颜色
- 考虑色盲友好的调色板
通过战略性地应用前注意属性,你可以引导受众的注意力,并创建一个清晰的视觉路径来讲述你的数据故事。
5. 应用设计原则以实现可访问和美观的视觉效果
形式追随功能。
优先考虑可访问性。 确保你的可视化易于广泛受众理解:
- 使用清晰、易读的字体
- 提供足够的文本与背景对比
- 包含描述性标题和标签
- 避免仅依靠颜色传达信息
创造视觉吸引力。 美观的设计被认为更易于使用且更具可信度:
- 对齐元素以创建秩序感
- 在整个设计中使用一致的样式(字体、颜色、间距)
- 平衡空白和内容
考虑你的媒介。 为不同格式调整你的设计:
- 演示文稿:更简单的视觉效果和更少的文本
- 报告:更详细的可视化和支持性解释
- 交互式仪表板:允许探索同时引导关键见解
记住,好的设计应该让观众感觉毫不费力。如果你的受众专注于设计本身而不是内容,你可能需要进一步简化。
6. 编织引人入胜的叙述以使数据栩栩如生
故事以数据无法做到的方式与我们产生共鸣并留下深刻印象。
结构你的故事。 使用经典的故事元素来吸引你的受众:
- 开始:设置背景并介绍问题
- 中间:展示你的数据和分析
- 结束:以见解和行动呼吁结束
制造张力。 突出当前情况与期望结果之间的差距以保持兴趣:
- 你的数据解决了什么问题?
- 为什么你的受众应该关心?
- 可以改进或改变什么?
使用叙述技巧:
- 重复:强化关键点
- 类比:使复杂概念变得易于理解
- 具体例子:用现实应用使数据栩栩如生
记住,你的数据应该支持你的故事,而不是故事本身。专注于“所以呢”——为什么这些信息重要以及它应该驱动什么行动。
7. 迭代并寻求反馈以完善你的数据故事
在数据交流方面,获得新视角的价值是不可估量的。
拥抱迭代。 你的第一次尝试很少是最好的。计划多次修订:
- 创建快速草稿以探索不同方法
- 离开一段时间后再回来重新审视
- 如果新想法更有效,愿意重新开始
寻求多样化的反馈。 不同的视角可以发现盲点并提高清晰度:
- 熟悉主题的同事
- 领域外的人(测试一般理解)
- 如果可能,目标受众的成员
测试理解。 向审阅者提出具体问题:
- 你认为主要信息是什么?
- 看到这个后你有什么问题?
- 根据这些信息你会做什么不同的事情?
利用从反馈中获得的见解来完善你的可视化和叙述。记住,目标是有效的沟通,而不是完美。通过迭代不断改进将帮助你发展更强的数据讲故事技能。
最后更新日期:
FAQ
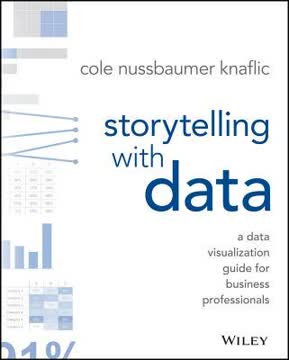
What's "Storytelling with Data" about?
- Purpose: "Storytelling with Data" by Cole Nussbaumer Knaflic is a guide for business professionals on how to effectively communicate data through visualization.
- Focus: The book emphasizes the importance of storytelling in data presentation, aiming to transform raw data into compelling narratives.
- Audience: It is written for anyone who needs to communicate data-driven insights, including analysts, managers, and leaders.
- Structure: The book is organized into lessons that cover understanding context, choosing visuals, eliminating clutter, focusing attention, thinking like a designer, and telling a story.
Why should I read "Storytelling with Data"?
- Improve Communication: It provides practical strategies to enhance your ability to communicate complex data clearly and effectively.
- Professional Edge: Mastering data storytelling can set you apart in the workplace, as it is a skill increasingly in demand.
- Broad Applicability: The lessons are applicable across various industries and roles, making it a versatile resource.
- Engaging Content: The book is filled with real-world examples and case studies that make the concepts relatable and easy to understand.
What are the key takeaways of "Storytelling with Data"?
- Understand Context: Before visualizing data, know your audience and what you want them to learn or do.
- Choose Effective Visuals: Select the right type of graph or chart to best convey your message.
- Eliminate Clutter: Remove unnecessary elements that do not add value to your data visualization.
- Tell a Story: Use narrative techniques to make your data more engaging and memorable.
How does Cole Nussbaumer Knaflic suggest choosing an effective visual?
- Visual Types: The book discusses various types of visuals like line graphs, bar charts, and scatterplots, and when to use each.
- Avoid Common Pitfalls: It advises against using pie charts, 3D effects, and secondary y-axes due to their potential to mislead.
- Consider Audience Needs: Choose visuals that are easy for your audience to understand and interpret.
- Practical Examples: The book provides examples of before-and-after visualizations to illustrate effective choices.
What is the importance of context in "Storytelling with Data"?
- Audience Understanding: Knowing who your audience is and what they need to know is crucial for effective communication.
- Purpose Clarity: Clearly define what you want your audience to do with the information you present.
- Data Relevance: Select data that supports your narrative and is relevant to your audience's needs.
- Consultation: The book suggests asking questions to stakeholders to fully understand the context before creating visuals.
How does "Storytelling with Data" address clutter in data visualization?
- Cognitive Load: Clutter increases cognitive load, making it harder for the audience to understand the data.
- Gestalt Principles: The book uses Gestalt principles to identify and eliminate unnecessary elements.
- Visual Order: It emphasizes the importance of alignment, white space, and contrast to create a clean visual.
- Step-by-Step Decluttering: Provides a process for systematically removing clutter from visuals.
How can preattentive attributes be used to focus attention according to "Storytelling with Data"?
- Definition: Preattentive attributes are visual properties that the brain processes quickly, such as color, size, and position.
- Attention Direction: Use these attributes to guide the audience's focus to the most important parts of the data.
- Visual Hierarchy: Create a hierarchy of information to lead the audience through the data in a logical order.
- Practical Application: The book provides examples of how to apply these attributes effectively in data visualization.
What does "Storytelling with Data" say about thinking like a designer?
- Form Follows Function: Design your visuals to serve the purpose of your communication effectively.
- Affordances: Use design elements that make it obvious how the audience should interact with the data.
- Aesthetics Matter: Aesthetic designs are perceived as easier to use and more engaging.
- Audience Acceptance: Strategies are provided for gaining acceptance of new or different visual designs.
How does "Storytelling with Data" suggest telling a story with data?
- Narrative Structure: Use a clear beginning, middle, and end to structure your data story.
- Conflict and Tension: Introduce conflict to engage your audience and drive the narrative.
- Repetition: Use repetition to reinforce key points and help them stick in the audience's memory.
- Practical Tactics: The book offers tactics like horizontal and vertical logic to ensure clarity in storytelling.
What are some of the best quotes from "Storytelling with Data" and what do they mean?
- "There is a story in your data." This emphasizes the book's core message that data should be transformed into a narrative to be impactful.
- "Clutter is your enemy." Highlights the importance of removing unnecessary elements to make data visualization clear and effective.
- "Think like a designer." Encourages readers to apply design principles to make data more accessible and engaging.
- "Tell a story." Reinforces the idea that storytelling is a powerful tool for making data memorable and actionable.
How does "Storytelling with Data" address the use of color in data visualization?
- Strategic Use: Color should be used sparingly and strategically to highlight important data points.
- Consistency: Maintain consistent use of color throughout a presentation to avoid confusing the audience.
- Colorblind Considerations: Design with colorblind audiences in mind, avoiding problematic color combinations like red and green.
- Tone and Emotion: Be mindful of the tone that colors convey and choose them to match the message.
What are some practical examples or case studies from "Storytelling with Data"?
- Dark Backgrounds: The book discusses how to adjust visuals for dark backgrounds to maintain readability and focus.
- Animation Use: It provides strategies for using animation in presentations to guide audience attention.
- Order Logic: Emphasizes the importance of logical order in data presentation to facilitate understanding.
- Spaghetti Graphs: Offers solutions for avoiding cluttered line graphs by emphasizing one line at a time or separating them spatially.
评论
《数据故事》因其在创建清晰、有影响力的数据可视化方面提供的实用建议而广受好评。读者们赞赏书中的逐步指导、前后对比示例以及对讲故事的关注。许多人认为这本书对初学者和商业专业人士非常有用。一些人批评它过于基础或在某些方面缺乏深度。总体而言,评论者推荐它作为提高数据沟通技能的宝贵资源,尽管有少数人指出,对于那些已经有经验的人来说,它可能没有那么有帮助。
Similar Books


